Full Report
Commercial real estate services is an agency business wrapped around other people's assets. The firms in it own very little of the property they transact, operate, value or finance; they sell access, execution and judgment to the people who do own it, and they are paid in fees that attach to specific events — a lease signed, a building sold, a loan closed, a month of building operations delivered, a design package issued, a fund's capital drawn. Colliers International Group reports its share of that business across three segments, Commercial Real Estate, Engineering and Investment Management, which together produced revenue of $5,558.5 million in the year to 31 December 2025 [1].
This tab describes the arena and the mechanics: what is sold, who pays, where the profit accumulates, how big the addressable pool is claimed to be and on what basis, which firms operate at scale, which conflicts are structural rather than incidental, and where managements themselves place the cycle. The record of named rivals measured against Colliers belongs to Competition; how the company arrived at its present shape belongs to History.
What the industry sells
The industry's revenue lines are not variations on a single product. They differ in who signs the cheque, in what has to happen before a fee exists, and in how tightly the fee tracks the volume of property changing hands.
Leasing fees are "typically earned after a lease is signed and are calculated as a percentage of the total value of rent payable over the life of the lease" [2]. In tenant representation the adviser works for the occupier but, as Newmark's filing puts it, "In many cases, landlords are responsible for paying the fees" [3]. Capital markets fees "are transactional in nature and generally earned at the close of a transaction as a percentage of the total value of the transaction" [2]. Outsourced building services are paid on "a fixed recurring fee or a variable fee, which may be based on hours incurred, a percentage mark-up on actual costs incurred or a percentage of monthly gross receipts" [2]. Investment management fees are charged on net asset value for perpetual vehicles and on committed or invested capital for closed-end funds [4].
Revenue by line for the year ended 31 December 2025 [1]; fee mechanics from the peer filings that describe them explicitly [2] [3] [4].
Purchasing power sits with a small number of repeat buyers. On the occupier side these are corporate real estate departments placing multi-year, multi-market mandates; on the investor side they are institutional owners, funds and lenders. Newmark records that occupiers and owners "are focused on consistency in service delivery and centralization of the real estate-related functions and/or procurement to maximize cost savings and efficiencies" [5], and Cushman and Wakefield describes the same clients consolidating "their services provider relationships on a regional, national and global basis to obtain more consistent execution across markets" [2]. The buyer is therefore concentrated even where the supplier base is not.
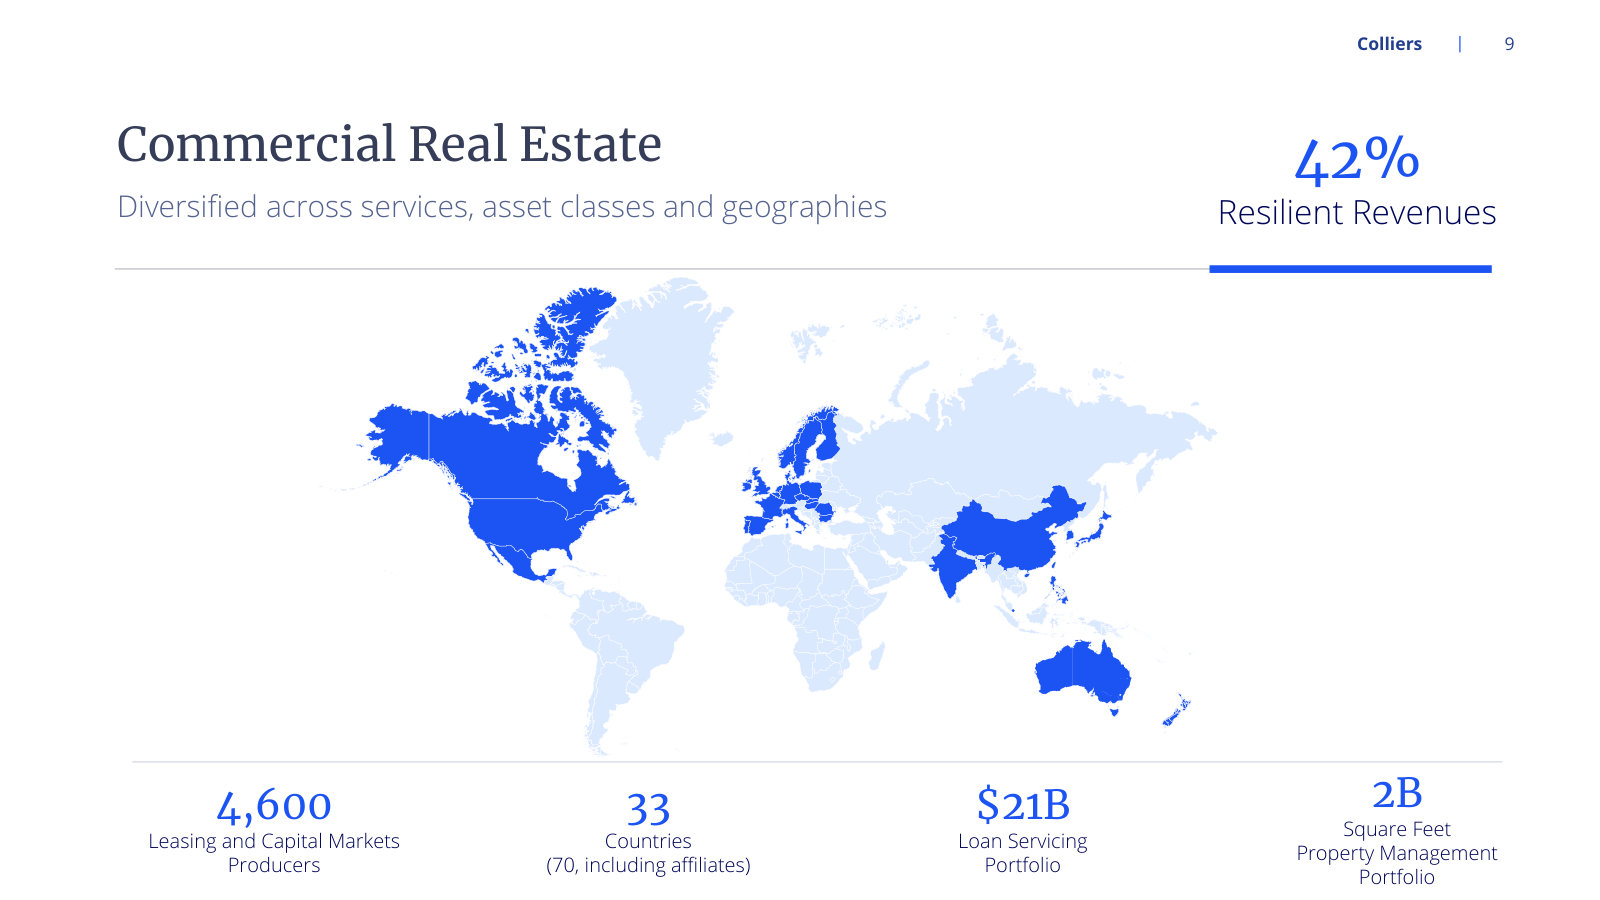
The producers who generate transaction revenue are a second locus of power. Newmark states plainly that "Our producers are largely compensated based on the revenue they generate for the firm, keeping these costs variable in nature" [6]. That arrangement converts a large slice of the cost base into a variable, which cushions downturns, and it also means the revenue line walks out of the building with the person. Colliers carries roughly 4,600 leasing and capital markets producers across 33 countries, or 70 including affiliates [7].
The value chain and its profit pools
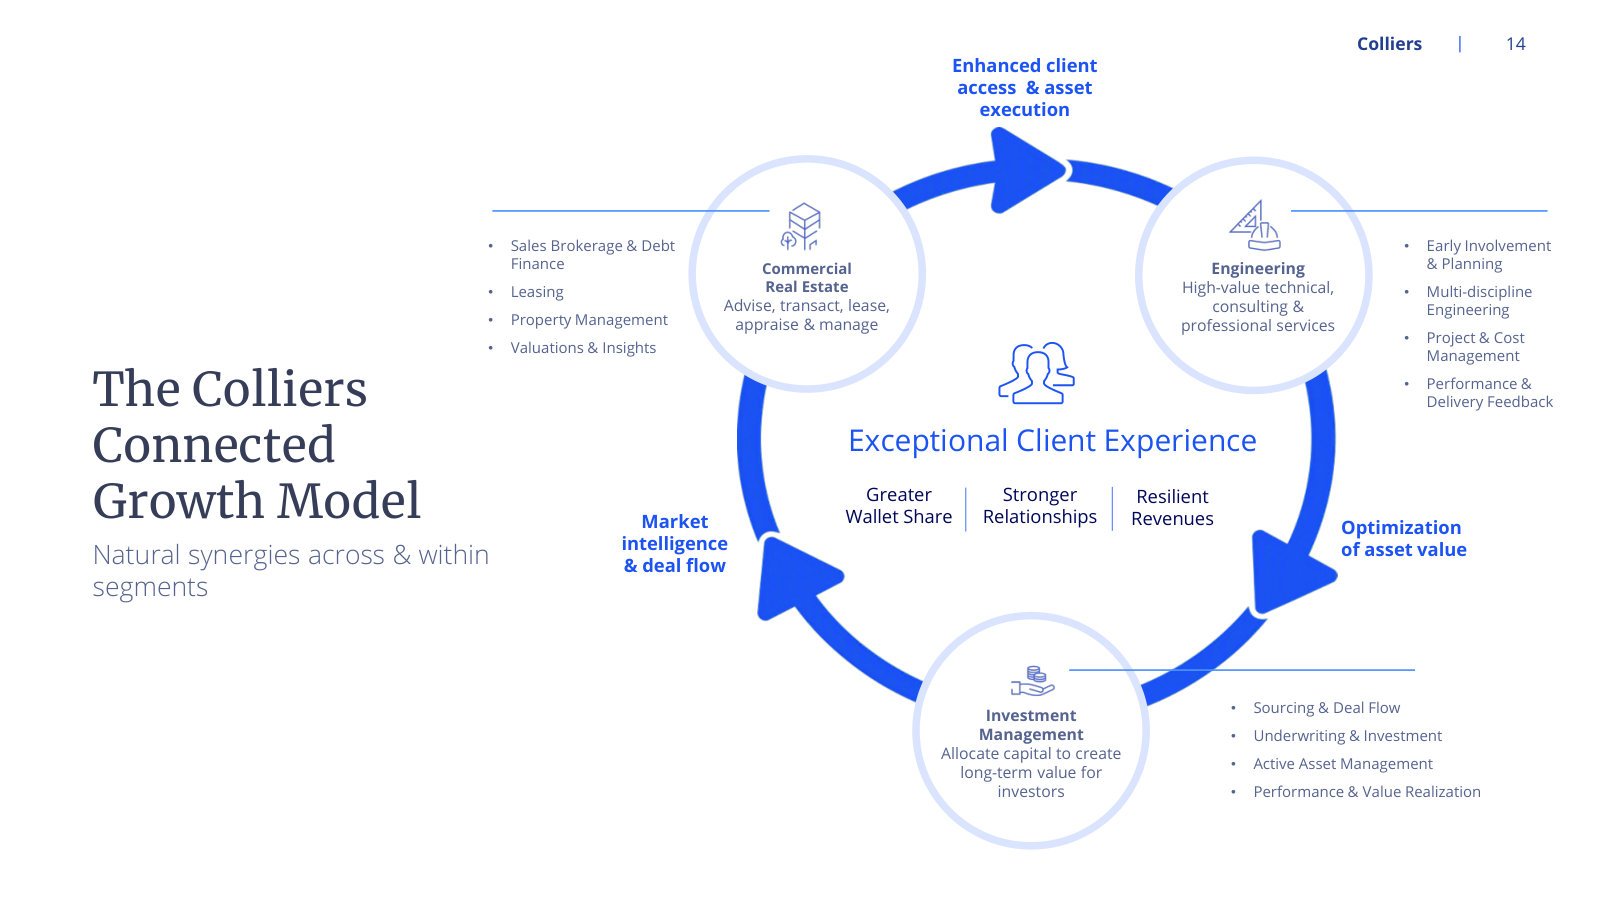
Follow one building through the chain and the sequence is: capital is raised and allocated; land is acquired and entitled; the asset is designed, permitted and built; it is financed; it is leased; it is operated and maintained; it is valued periodically for accounts, lenders and regulators; and eventually it is sold and the cycle restarts. Colliers participates at every one of those stations, and the segments map onto them: Engineering at the front end, Commercial Real Estate across financing, leasing, operations and sale, Investment Management at the capital-formation end.
The revenue and the margin sit in different places.
Computed from the segment note for the year ended 31 December 2025: segment revenue of $5,557,792 thousand and segment adjusted EBITDA of $746,443 thousand [8].
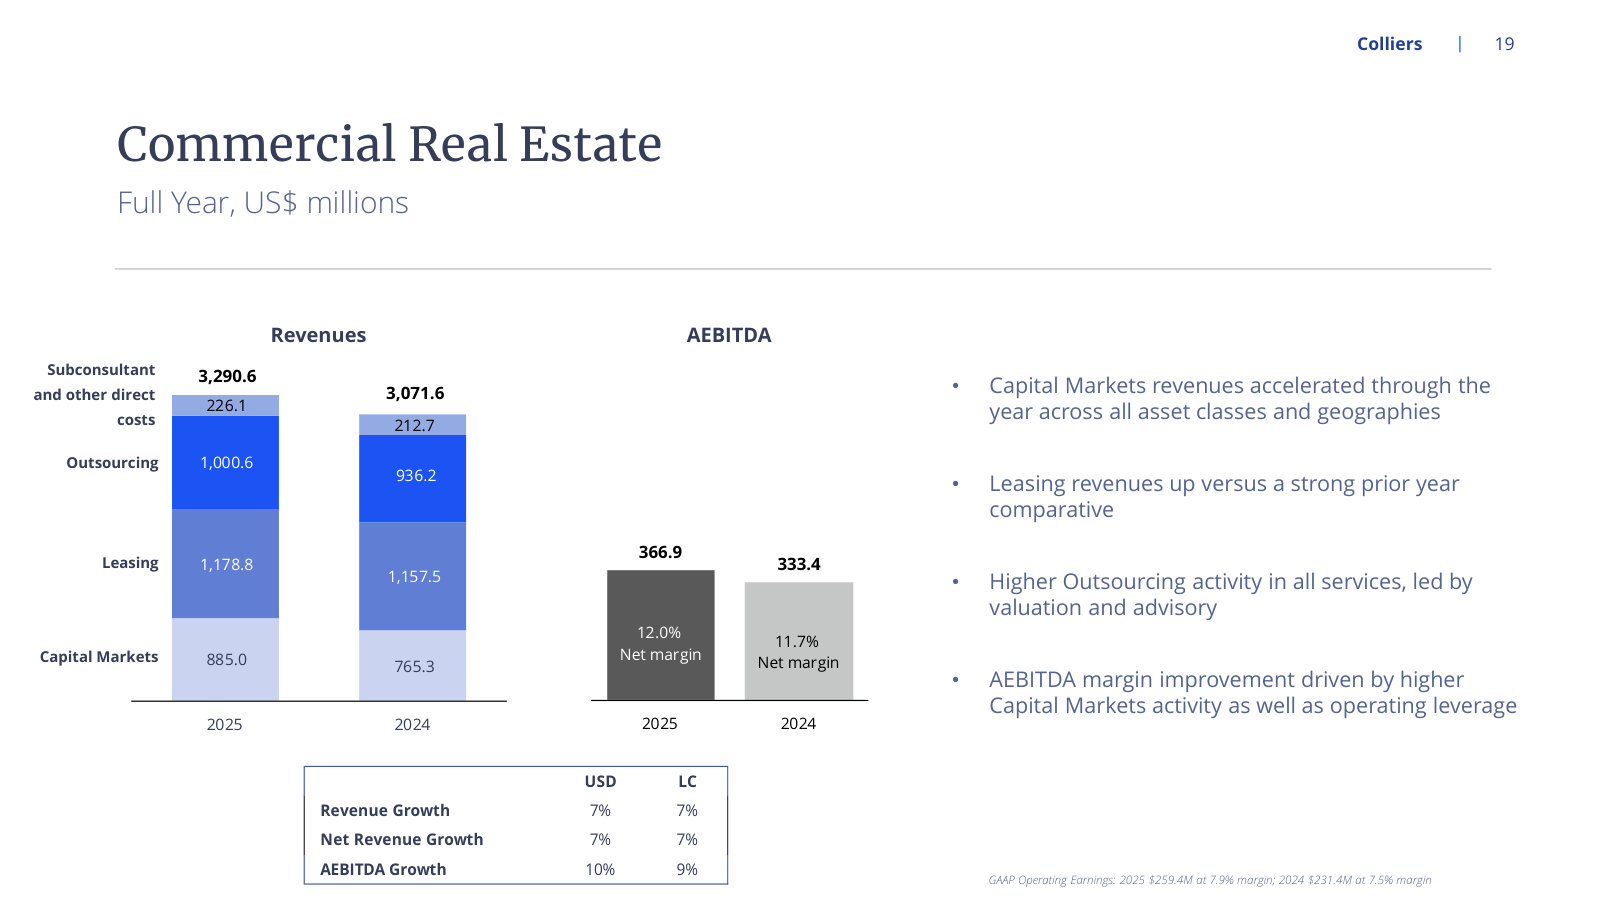
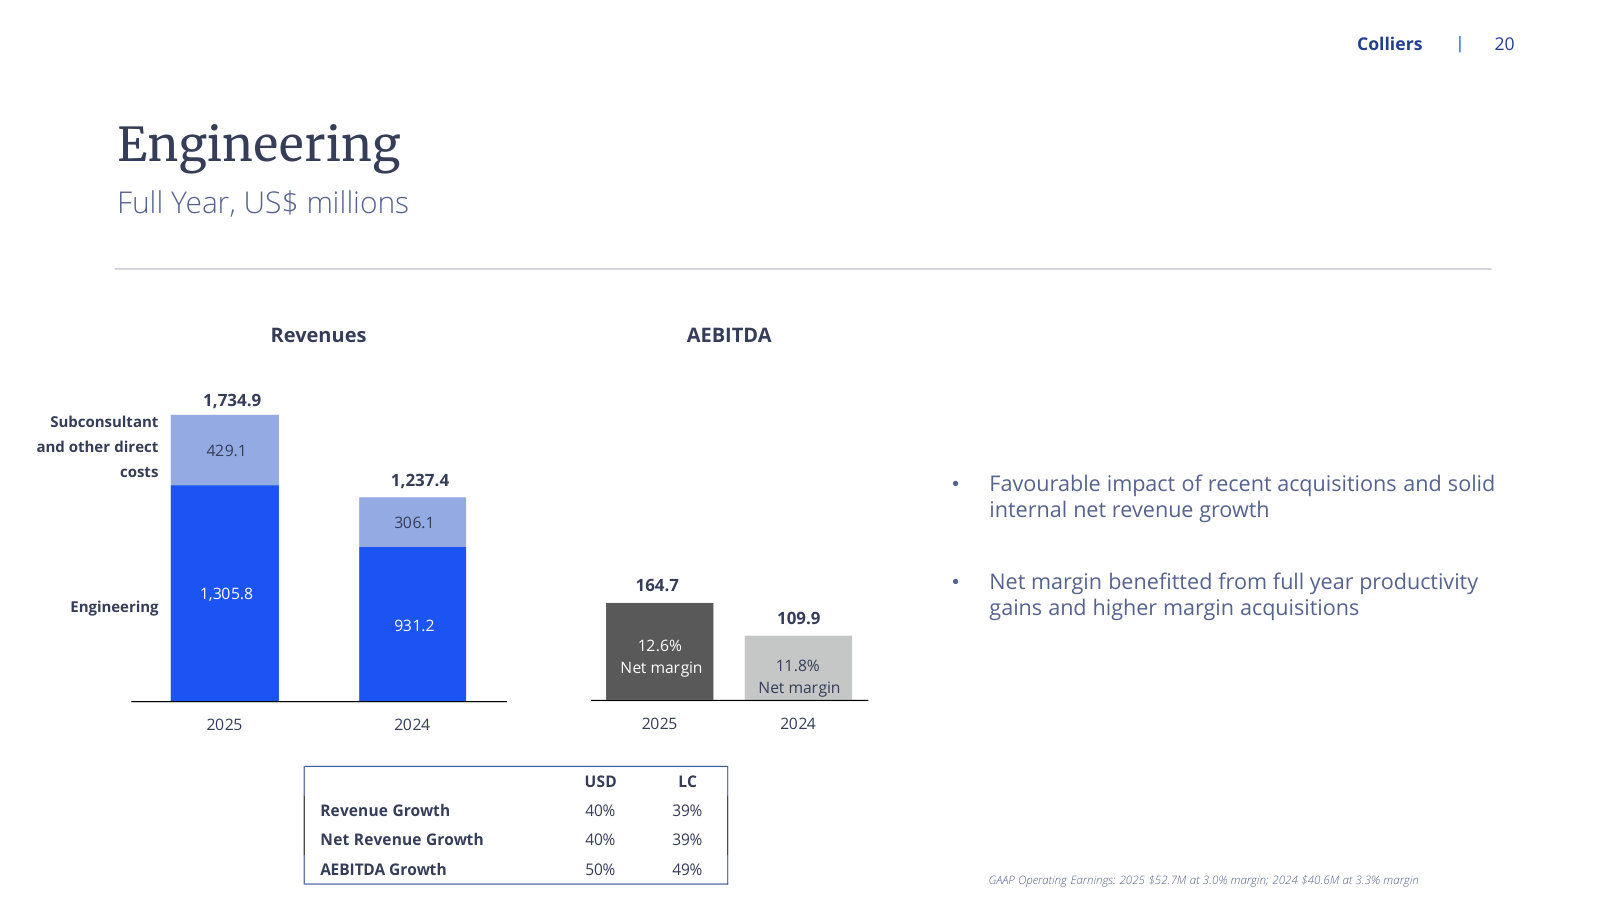
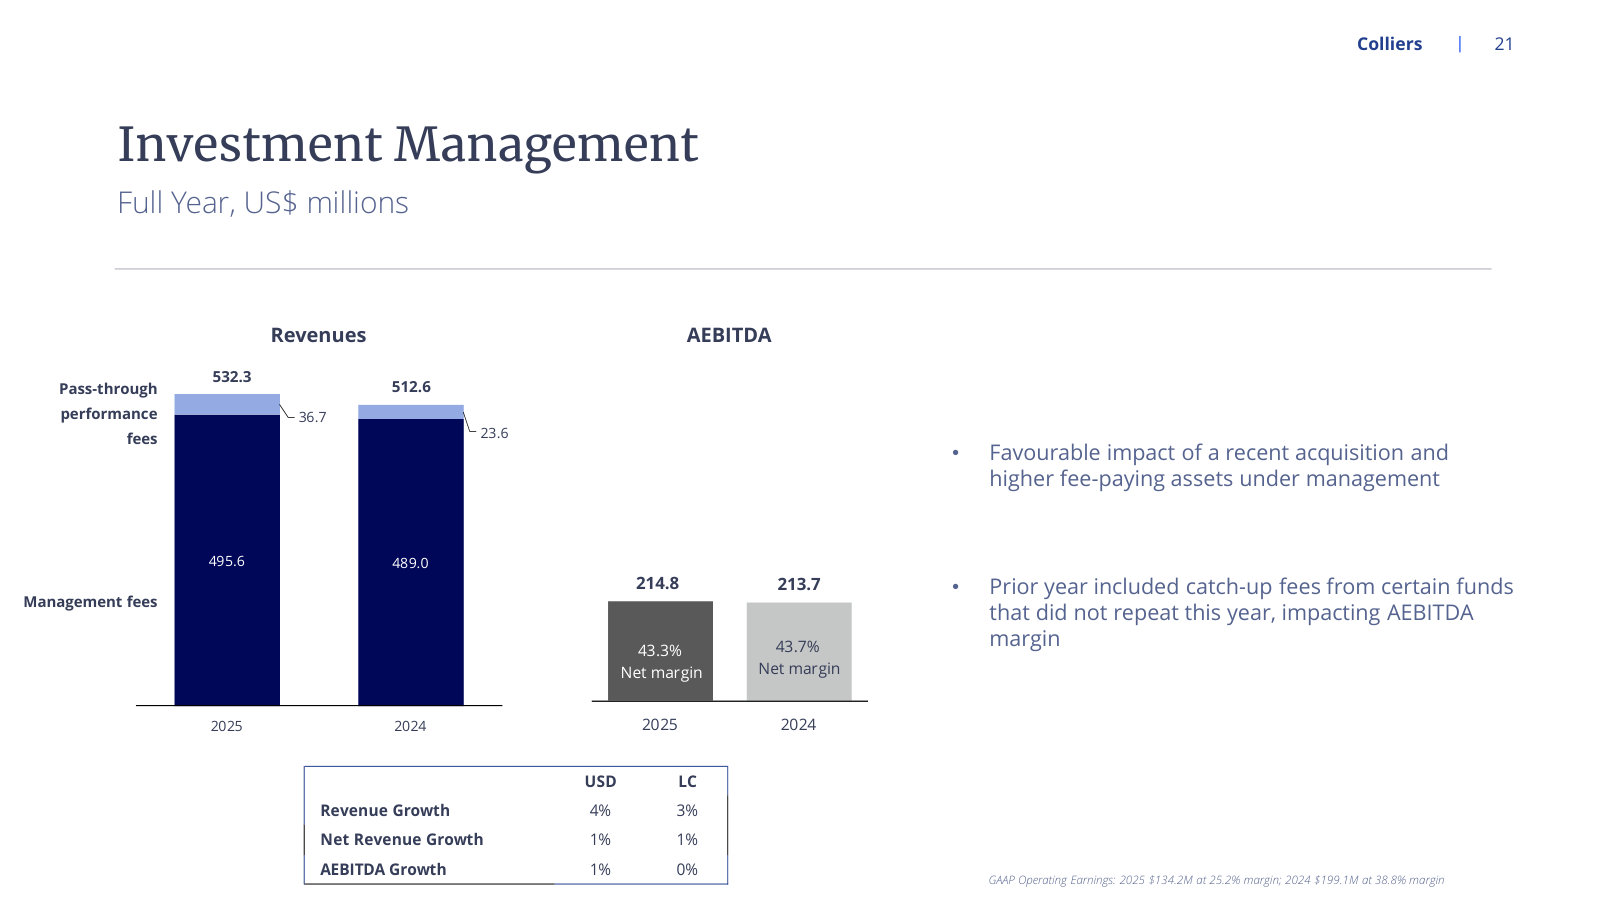
Investment Management supplies under a tenth of revenue and close to three-tenths of segment adjusted EBITDA. Engineering does the reverse: it is the largest single revenue line in the company and the thinnest-margin segment of the three. Commercial Real Estate sits between, and is where the pass-through economics are heaviest — cost of revenue absorbs $2,128.6 million of its $3,290.6 million.
Segment note, years ended 31 December 2025 [8] and 31 December 2024 [9]. Segment adjusted EBITDA is the company's own measure and excludes, among other items, depreciation and amortisation, acquisition-related items, restructuring and stock-based compensation [8].
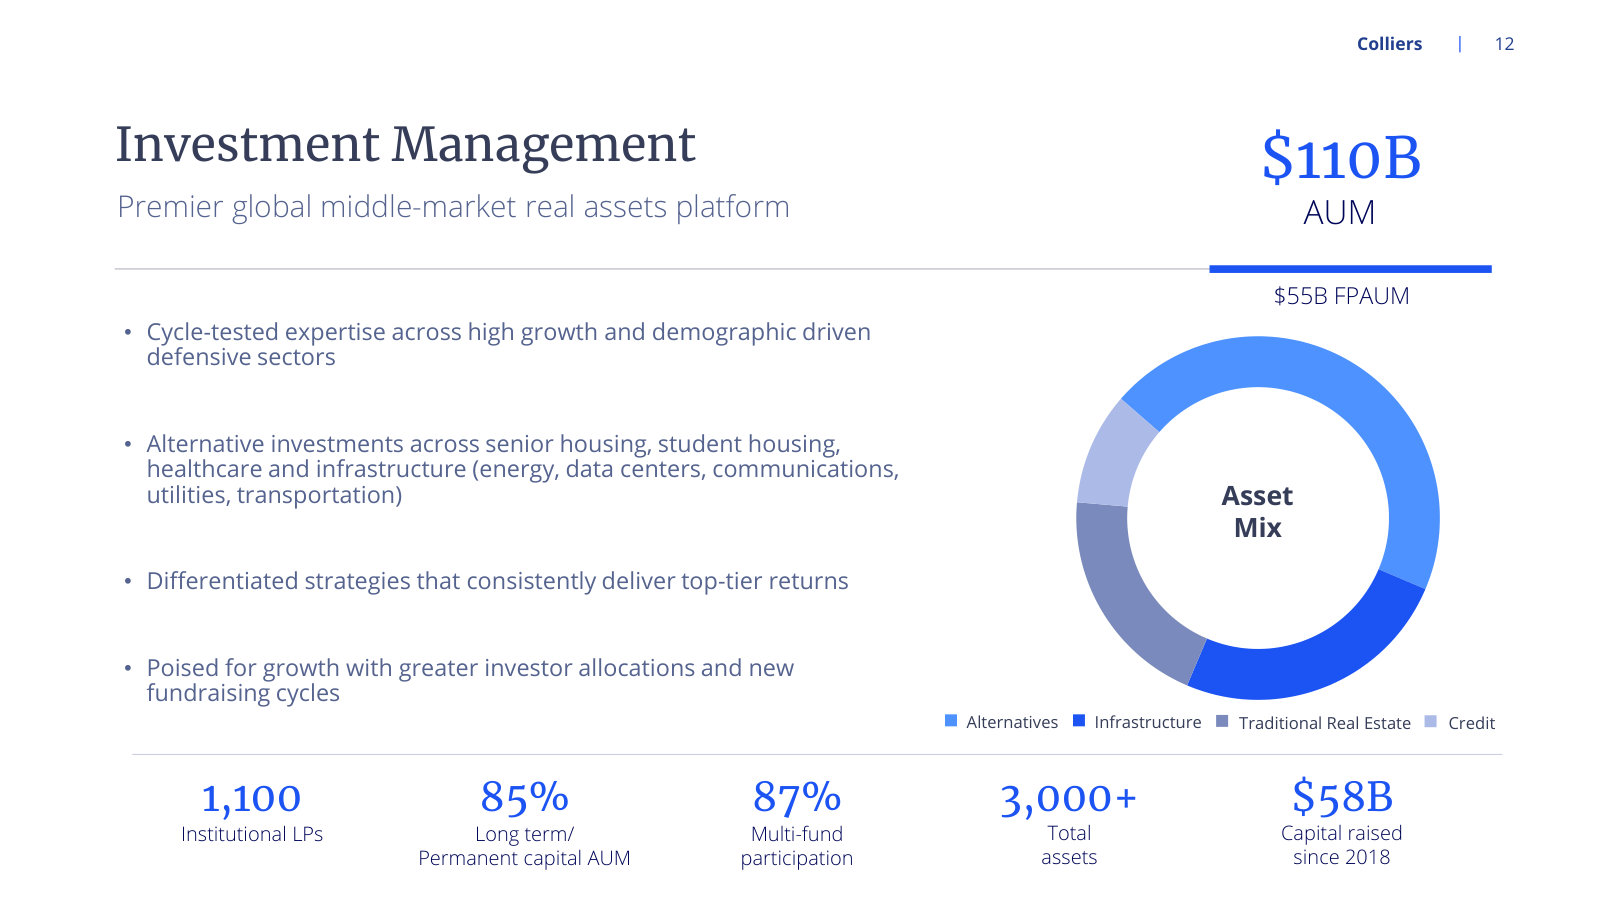
Two structural reasons sit behind the spread. Transaction and outsourcing revenue is produced by people, and the marginal person costs roughly what the marginal fee pays. Fund management revenue is produced by a stock of capital that renews itself contractually: Colliers reports $110 billion of assets under management against $55 billion of fee-paying assets, 1,100 institutional limited partners, and 85% of that capital described as long-term or permanent [10]. Fee-paying capital is a smaller base than headline assets under management, which is the number that carries the margin.
The same asymmetry appears at the top of the industry. CBRE, the largest firm by revenue, notes that its loan servicing and valuations businesses are "a smaller part of our revenue mix" yet "have proven to be resilient across economic cycles", with loan servicing revenue organically compounding "at a low-double digit compound annual growth rate" over seven years [11]. Servicing portfolios are an annuity attached to loans already made; Colliers carries a $21 billion loan servicing portfolio and manages roughly 2 billion square feet of property [7].
Sizing the arena
No independent market-size feed was collected for this run, so the figures below come from operators' own filings and from the third-party surveys they cite. They are vendor and issuer estimates, each carrying its own scope and measurement date, and they are not audited.
All five rows are drawn from Newmark's FY2025 annual report, which is the only source in this corpus that sizes the industry: the revenue pool [3]; the top-ten share, the Cornell Baker Program and Hodes Weill allocation survey, and the Mortgage Bankers Association debt figure [12].
The revenue pool is Newmark's own estimate of "a more than $400 billion global revenue market opportunity", defined as "the actual and/or potential revenues that are or could be generated annually by public and private commercial real estate services firms" [3]. Three caveats travel with it, and Newmark states all three. It counts work currently performed in-house by owners, lenders and occupiers that "could be partially or entirely outsourced" — that is, revenue that does not exist today. It includes service lines Newmark itself does not offer, such as investment management. And it is stated in US dollars without a single measurement date, being built from several underlying sources [12]. Against a pool defined that expansively, Colliers' $5.6 billion of revenue is a low-single-digit share, and the arithmetic is only as sound as the denominator.
Fragmentation is the more useful structural fact, and it is the same source's claim: "less than 20% of the potential revenue in the global commercial real estate services market is currently serviced by the top 10 global firms (by total revenues)" [12]. CBRE frames its competitive set consistently with that: competitors "range from a handful of well-established globally diversified real estate services firms that are smaller than CBRE to many specialists that operate in specific geographies or business lines" [13]. JLL puts the local case bluntly: "Many of our competitors are local or regional firms, which may be substantially smaller in size than us but hold a larger share of a specific local market" [14].
Demand-side measures are better dated. The weighted average target allocation to real estate across global institutional investors rose from 5.6% of portfolios in 2010 to 10.8% in 2025, and the same survey expects it "relatively flat at 10.8% in 2026". Preqin put undeployed closed-end real estate capital at approximately $561 billion at 31 December 2025, down from $649 billion a year earlier but well above $328 billion at the end of 2015; MSCI's most recent reading of global funds under management by real-estate-focused institutional investors was $12.5 trillion in 2024 [12].
The debt stock is the clearest near-term driver of transaction fees. The Mortgage Bankers Association counts approximately $5.0 trillion of US commercial and multifamily mortgage debt outstanding, of which roughly $2.1 trillion matures between 2026 and 2028 [12]. Origination volume is the flow that pays the fee.
Mortgage Bankers Association figures as reported by Newmark; Newmark Research estimates US originations rose 43% in 2025, and the MBA's January 2026 forecast projected a further 27% increase in 2026 [12]. No dollar level is published for 2025 or 2026 in the cited source, so those two years are stated as growth rates rather than charted.
The interest-rate context matters because capital markets demand "is often dependent on attractive all-in borrowing rates versus expected asset yields". Ten-year US Treasury rates averaged approximately 4.3% in 2025, against approximately 5.8% over the fifty years ended 31 December 2025 [12].
Two limitations are worth stating outright. First, nothing in this corpus supports a defensible market-share estimate for any firm against the $400 billion pool, because the pool includes unoutsourced work and no participant reports revenue on a matching basis. Second, no source here allocates industry profit across the value chain; the profit-pool reading above is Colliers' own segment disclosure, and the peer comparison that follows is drawn at the company rather than the service-line level.
Who competes, and at what scale
Six firms appear in the peer set for this run, all six drawn from Colliers' own management information circular comparator group. They are not all the same business. CBRE, JLL, Cushman and Wakefield and Newmark are commercial real estate services firms whose lines overlap Colliers' Commercial Real Estate segment directly. WSP and Stantec are engineering and professional services firms that overlap the Engineering segment and do not compete in brokerage at all.
FY2025 revenue and operating margin per the comparison feed used across this report; peer figures trace to each firm's reported income statement [15] [16] [17] [18]; business lines from each firm's own description [19] [2] [3]. Colliers' revenue is its reported consolidated figure [1].
Two comparability limits apply to that table. The operating margin column comes from a single comparison feed so that the definition is consistent across firms; Colliers' own segment note reports consolidated operating earnings of $370,958 thousand on consolidated revenue of $5,558,462 thousand, a 6.7% margin, against the 7.2% carried in the feed. The difference is definitional, not a restatement. Separately, the peer inputs for CBRE, JLL, Cushman and Wakefield and Newmark derive from filed US statements, while Colliers', WSP's and Stantec's come from a market data provider — another reason to read the margin column as an ordering rather than a precise gap.
CBRE describes itself as "the world's largest commercial real estate services and investments firm (based on 2025 revenue)", operating in more than 100 countries and serving "nearly 90% of Fortune 100 companies" in 2025 [19]. It had more than 155,000 employees at 31 December 2025, with the costs of approximately 61% of them reimbursed by clients — a reminder that in outsourced building services a large part of reported revenue is a pass-through [13]. Its development arm, Trammell Crow, carried an in-process portfolio and pipeline of over $29.5 billion at the same date [13].
Newmark occupies the other end of the size range and the highest reported margin, a position it attributes to business mix and to producer productivity. It facilitated $1.6 trillion of notional leasing, investment sales, mortgage brokerage, debt placement and appraisal value in 2025 [5].
The engineering adjacency cannot be placed in the same dollar column. WSP and Stantec report in Canadian dollars, and their figures are not restated here: WSP reported FY2025 revenue of C$18,285.0 million at a 9.7% operating margin [20] and Stantec C$8,144.2 million at 8.8% [21]. Both operate at a higher reported operating margin than any of the pure brokerage-weighted firms, which is the relevant structural observation: design and project delivery is contracted work billed against a backlog, not a transaction fee contingent on a closing.
Conflicts built into the model
Several conflicts in this industry are structural — they arise from the shape of the business rather than from conduct — and the filings say so.
The first is agency. A firm advising a tenant is frequently paid by the landlord [3]. The second is cross-divisional. JLL's risk factors describe fiduciary obligations arising from "the decisions we make on behalf of a client with respect to managing assets on its behalf, purchasing products or services from third parties or other divisions within our Company, or handling substantial amounts of client funds" [22]. A diversified platform that can lease, manage, value, finance and own the same asset has more ways to earn and more ways to be conflicted; the two grow together.
The third is valuation-specific, and it is cyclical. JLL notes that "After reductions in the market values of the underlying properties, firms engaged in the business of providing valuations are inherently subject to a higher risk of claims with respect to conflicts of interest based on the circumstances of valuations they previously issued", and that "the allegations themselves can cause reputational damage and can be expensive to defend" regardless of merit [22]. Valuation and advisory was $531.3 million of Colliers' FY2025 revenue [1].
The fourth is principal-versus-agent. Every large firm here manages third-party capital alongside an advisory business that transacts with the same asset classes. JLL also records that regulation "could be changed to limit our ability to act for certain parties where potential conflicts may exist even with informed consent, which could limit our market share in those markets" [22].
A fifth is licence dependence, and it is narrower but sharper. US agency lending runs through a short list of approved counterparties: Newmark notes it is "one of 25 approved lenders that participate in the Fannie Mae DUS program and one of 23 lenders approved as a Freddie Mac seller/servicer" [23]. That approval "may be limited, suspended or terminated by the applicable GSE or HUD at any time, in whole or in part, with or without cause" [24]. It is a genuine barrier to entry and a genuine single point of failure at the same time.
The sixth is competitive rather than ethical, and it runs in the opposite direction to scale. JLL lists competition from "institutional lenders, insurance companies, investment banking firms, investment managers, accounting firms, technology firms, consulting firms, co-locating providers, temporary space providers and firms providing outsourcing of various types", plus "firms that self-perform their real estate services with in-house capabilities" [14]. The client can always take the work back in-house, which is exactly the revenue the $400 billion pool counts as addressable.
Three currents
Provider rosters are consolidating onto fewer platforms. Cushman and Wakefield states that "Those few firms with scalable operating platforms are best positioned to improve their profitability and market share as real estate occupiers and investors become increasingly global and require commercial real estate services partners that can match their geographic reach and complex real estate needs" [2]. CBRE describes clients' "increasing preference for consolidating the number of service providers" [13]. Both statements are the suppliers' own, and both sit alongside the same firms' acknowledgement that local specialists still hold larger shares of specific markets [14]. Consolidation of mandates and fragmentation of supply are coexisting, not sequential.
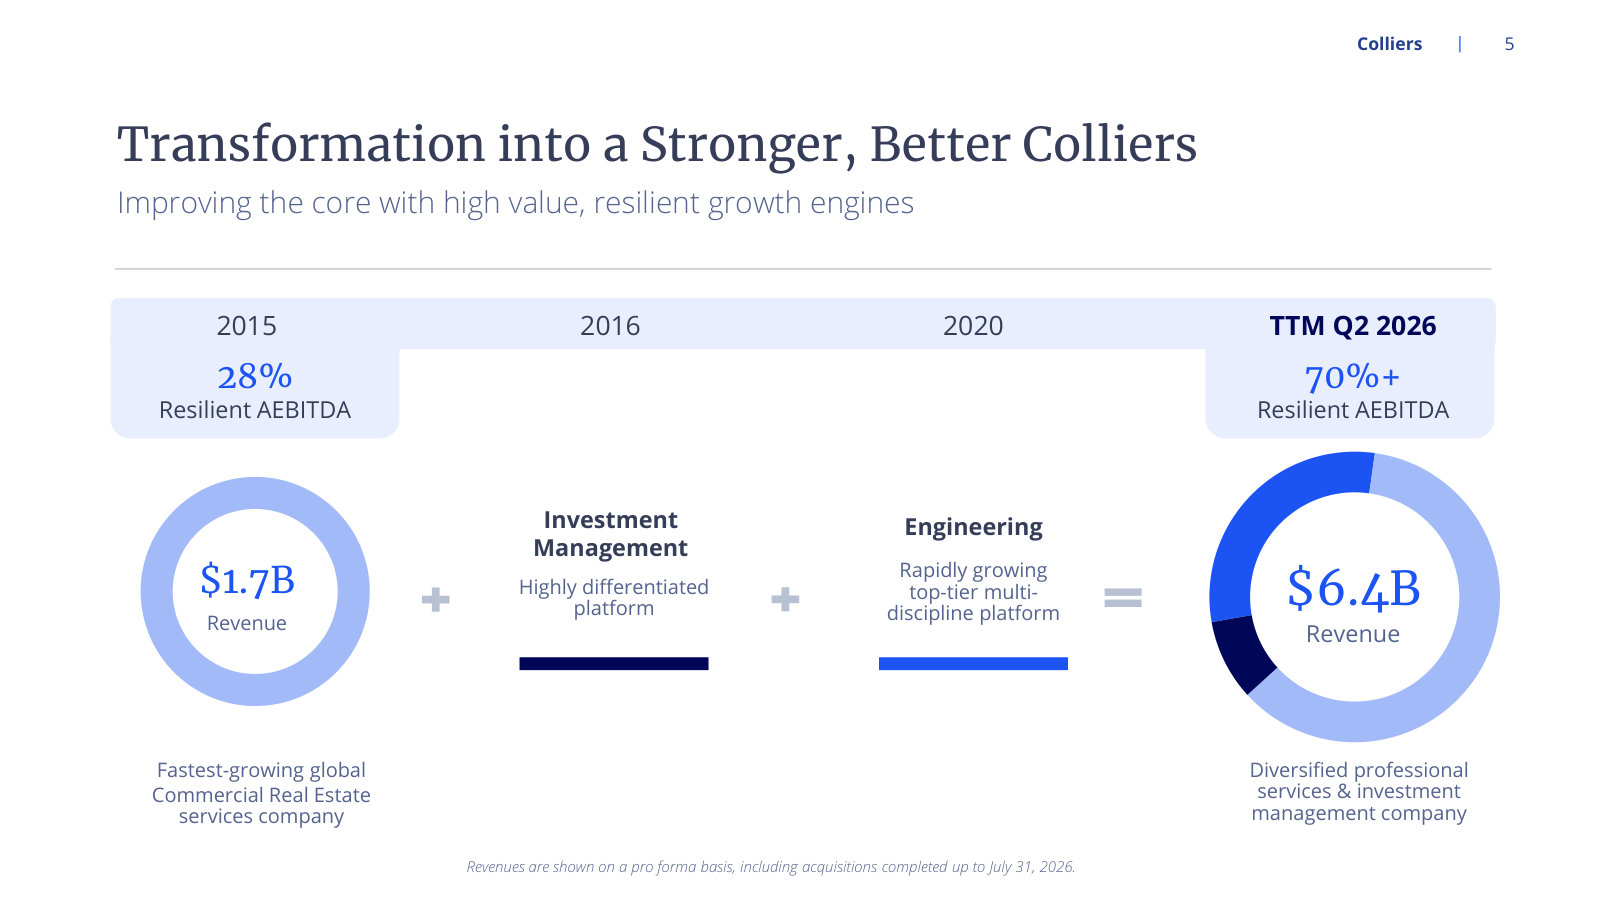
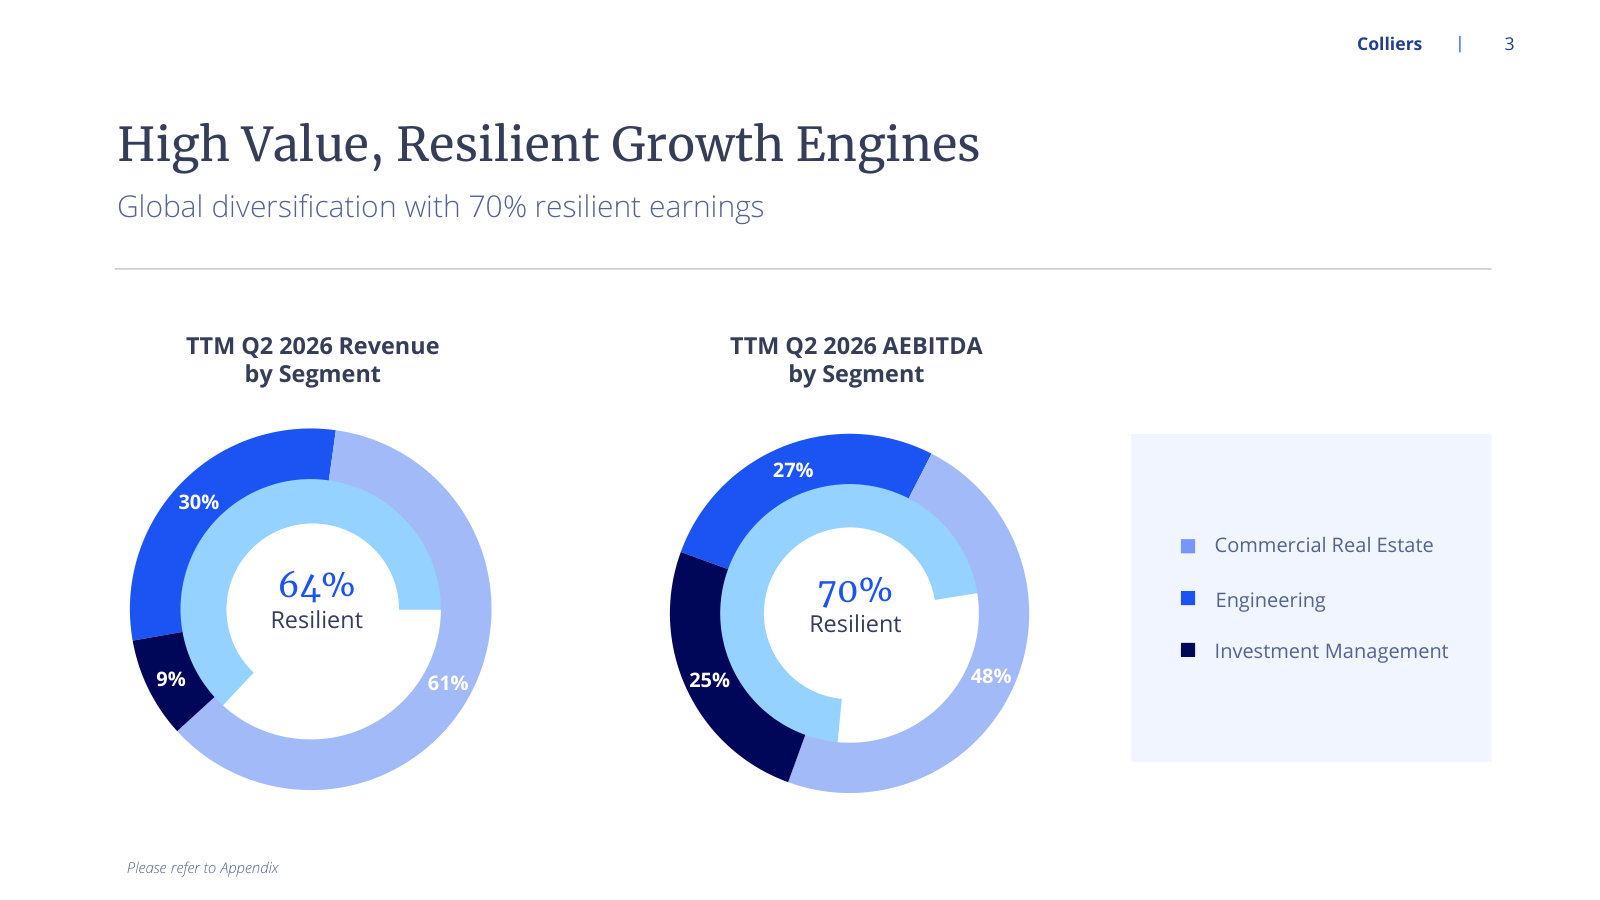
The earnings mix is being rebuilt around contracted revenue. Across the industry the deliberate move has been away from closing-contingent fees and toward recurring ones. CBRE created a Building Operations and Experience segment in 2025 to unify facilities and property management, and merged its project management business into Turner and Townsend, in which it now owns 70% [11]. Colliers' version has been Engineering, which grew from $564.6 million of revenue in 2021, when it was reported as engineering, design and project management, to $1,734.9 million in 2025, and Investment Management. Management stated in July 2026 that "approximately 70% of our earnings come from resilient, recurring revenue streams" [25].
Investment management combines advisory and other with incentive or performance fees. The 2021 and 2022 columns come from the FY2022 disaggregated revenue note, where the engineering line was reported as engineering, design and project management [26]; 2023 and 2024 from the FY2024 note, which restated 2023 onto the present segment basis [28]; 2025 from the FY2025 note [1]. One caution on that restatement: the FY2023 report, filed before the segment change, showed 2023 leasing of $1,063,088 thousand and valuation and advisory of $436,941 thousand, against $1,063,355 thousand and $423,999 thousand as restated [27].
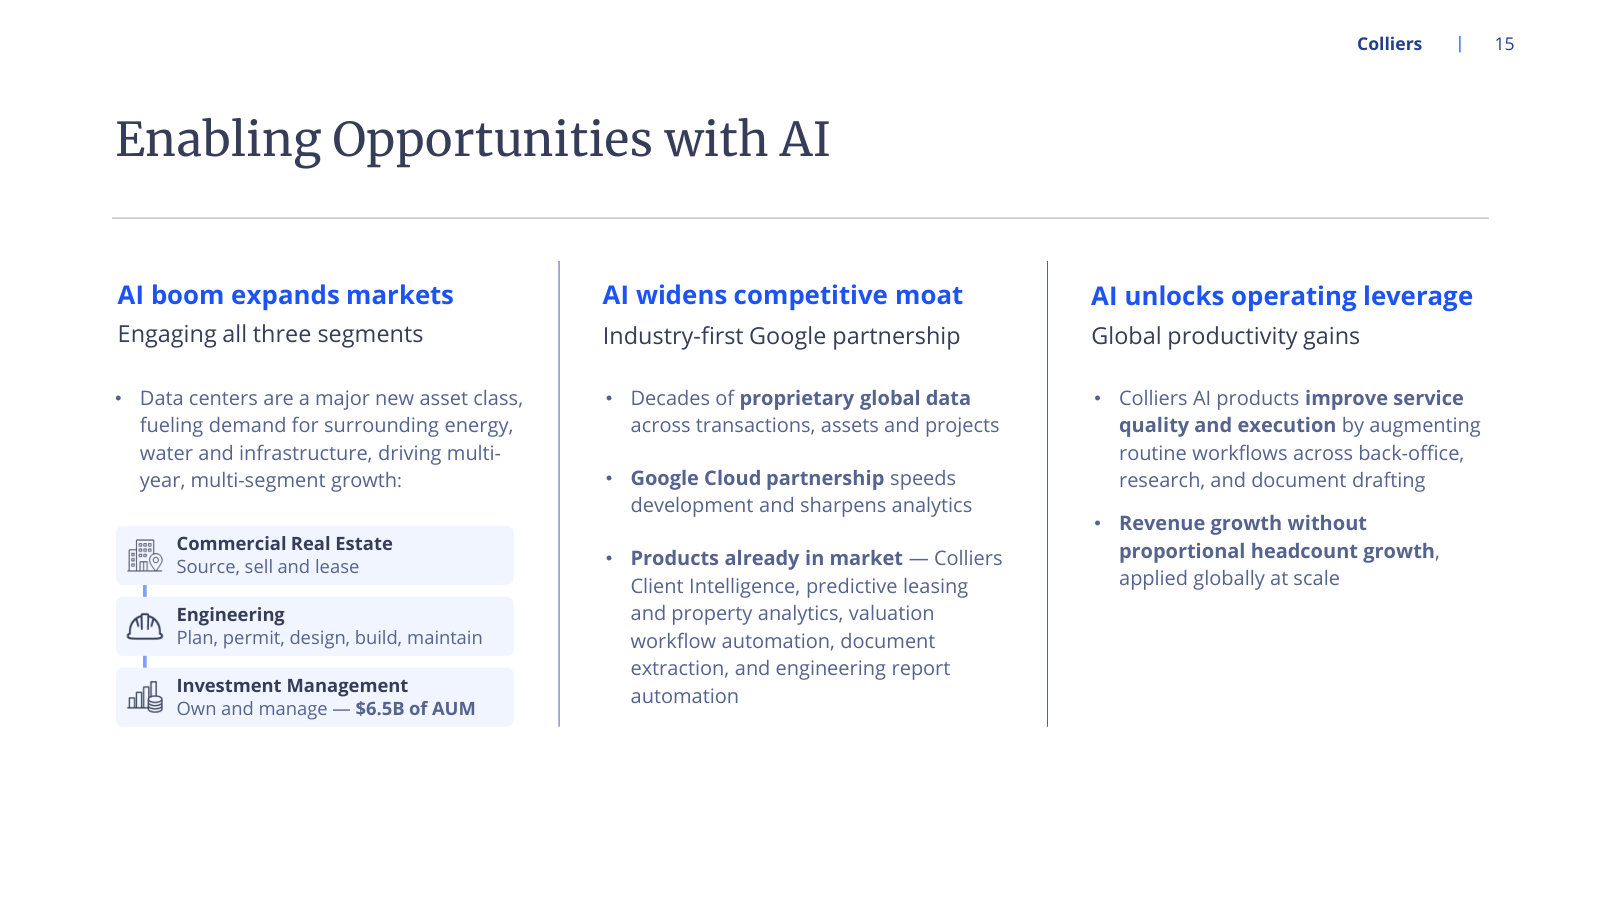
Data centres and the power, water and land around them have become a cross-chain demand source. Colliers presents the asset class as engaging all three of its segments — sourcing, selling and leasing sites; planning, permitting, designing and maintaining them; and owning them, with $6.5 billion of assets under management attached [29]. Its investment management arm has invested more than $6 billion in digital infrastructure and data centres over six years [25]. At CBRE the same demand shows up as a Critical Infrastructure Services line growing 68% year on year and a Data Center Solutions business growing nearly 30% in the June 2026 quarter [30]. Newmark's chief executive described "a lot of large transactions in the pipeline with data centers, digital infrastructure and large office coming back" [31]. What is observable is that four independent firms report the same demand source in the same quarter; what is not observable from this corpus is the durability of that demand or its margin profile.
Where the cycle sits
The transaction cycle turned down in 2022 and 2023 and has been recovering since. Colliers' own capital markets line dates the shape precisely: $1,236.2 million in 2021, $702.5 million in 2023, and $885.0 million in 2025 — a 43% peak-to-trough fall, and a 2025 level still about 28% below the 2021 peak.
Capital Markets revenue as disclosed in the disaggregated revenue notes for FY2022 [26], FY2024 [28] and FY2025 [1].
The trough is datable from management commentary. On 2 May 2023 Colliers reported that "as expected, capital markets declined considerably in line with overall market conditions", attributed it to "higher interest rates and challenging debt markets", and added that with "the additional stress on the banking system and increasing limitations on debt availability, there is more uncertainty around property valuations. Until these factors become more predictable, we expect the level of transaction activity to remain low" [32].
Three years later the same management placed the recovery explicitly: "it is a continuation of this multi-quarter recovery in capital markets activity that, you know, we think we're in the early to mid-innings of a recovery. We have a couple of years at least, you know, to go to recover to prior peak transaction levels" [33]. Full-year 2026 guidance given on that call was capital markets growth "somewhere in the 25% range", leasing "in the 8% range" and outsourcing "in the 5% range" [33].
The most recent quarter reported by all four commercial real estate services firms in this corpus is the three months to 30 June 2026. Reading them together is the cleanest available cycle triangulation, because each management quantifies the same two lines.
Colliers Q1 2023 [32], Q1 2026 [33] and Q2 2026 [25]; CBRE [30]; JLL [34]; Cushman and Wakefield [35]; Newmark [36].
Leasing is unanimous: all four firms grew it by double digits in the same quarter, with office strength named in each. Capital markets is not. Three firms grew it between 16% and 20%-plus; Cushman and Wakefield reported that "Revenues declined 1% globally following 6 consecutive quarters of strong growth. In the Americas, revenue was down 6%, driven primarily by industry softness in office and midsized multifamily transactions where our business is more highly concentrated" [35]. The company attributes the gap to asset-type concentration rather than to a market turn, and reported APAC and EMEA capital markets up 50% and 11% in the same quarter [35]. JLL's read of the same US market was that its own investment sales growth was "nearly double the broader market" [34], which is consistent with a market growing more slowly than the largest firms within it. Newmark noted lower origination activity against a prior-year quarter in which total debt volumes had risen 134.8% [36].
Three points follow from the spread rather than from any one reading. Recovery in this cycle is being reported unevenly by asset type, with office and industrial leasing ahead of mid-sized multifamily and office investment sales. Firm-level growth rates in a recovering market contain a share component that is not separable from the market component using these disclosures. And the recovery is being measured against a 2023 base low enough that percentage growth overstates the return to prior volume — Colliers' own capital markets revenue is still below its 2021 level after two years of growth.
One forward-looking item is worth recording as a structural change to the arena rather than a cycle read. In February 2026 Colliers agreed to acquire Ayesa Engineering S.A.U. of Seville for total cash consideration of approximately $700.0 million, and amended its revolving credit facility to a five-year term maturing 19 February 2031 with a temporary covenant step-up from 3.5 times to 4.0 times for up to four quarters following an acquisition above $200.0 million [37]. Engineering was already the fastest-growing segment before that transaction closed.
Geographically, the industry's revenue is concentrated where its transaction volume is. Colliers recorded $2,884.0 million of FY2025 revenue in the United States and $909.9 million in Canada, against $472.9 million in euro-currency countries, $352.8 million in the United Kingdom and $342.5 million in Australia [37]. JLL's risk disclosure sets the counterweight: trade barriers "can directly increase the cost and complexity of real estate projects by raising prices for essential construction materials and technology", and geopolitical conditions "can cause clients to delay or reconsider real estate investment and leasing decisions, leading to longer sales cycles and potentially lower transaction volumes" [14].
Terms used here
Colliers reports in three segments — Commercial Real Estate, Engineering, and Investment Management — and each one meets a different set of rivals. The company describes itself as serving corporate and institutional clients in 33 countries, or 70 including affiliates and franchisees [1]. In FY2025 those segments produced revenues of $3,290.6M, $1,734.9M and $532.3M respectively, and Segment Adjusted EBITDA of $366.9M, $164.7M and $214.8M [2]. The segment labels are themselves in motion: the company realigned its Commercial Real Estate and Engineering segments to reflect new management reporting lines effective in the first quarter of 2026 [3].
This tab records who the rivals are, what their own filings say, and what the contracts underneath the revenue actually specify. The arena's structure and value-chain economics sit in Industry; the raw filings shelf sits in Competitors.
The comparator set below was not taken from a screen. Four of the six names were confirmed from the rivals' own disclosure. Cushman and Wakefield's Competition section names "Colliers International Group Inc. (Nasdaq: CIGI)" alongside JLL and CBRE, while describing itself as "one of the three largest global commercial real estate services firms" [4]. Newmark's competition disclosure lists Colliers among CBRE, JLL, Cushman and Wakefield and Savills, plus specialists including Eastdil Secured, Walker and Dunlop, Berkadia and Trimont [5]. JLL names Colliers among its primary competitors [6], and CBRE includes Colliers in the peer group it uses for relative total shareholder return [7]. WSP Global and Stantec are engineering and design firms; neither names Colliers, and their reporting model differs enough that they are held out of the like-for-like economics below.
Where the Overlap Sits
Source: segment structures per CBRE FY2025 10-K [8], JLL FY2025 10-K [9], Cushman and Wakefield FY2025 10-K [10], Newmark FY2025 10-K [11], WSP FY2025 annual report [12] and Stantec FY2025 annual report [13].
Stantec reports that no individual customer exceeds 10% of its gross revenue, and splits that revenue across Infrastructure, Water, Buildings, Environmental, and Energy and Resources rather than by property type [14]. Colliers' engineering business is organised around the same disciplines, which is why the two are comparators for that segment only.
Scale Across Three Years
Revenue as reported, $ billions. Colliers per pinned company facts; CBRE segment note [15]; JLL results of operations [9]; Cushman and Wakefield Item 1 [10]; Newmark results of operations [11].
The ranking is stable and the gap is wide. CBRE's FY2025 revenue of $40,550M is more than seven times Colliers' $5,558.5M [15] [16].
Two Revenue Rulers
Most of that gap is pass-through. CBRE separately discloses pass-through costs of $16,746M inside its FY2025 revenue, being reimbursable costs of subcontracted third-party vendor work [15]. JLL carries $17,158.2M of gross contract costs against FY2025 revenue of $26,115.6M [9]. Cushman and Wakefield reports total service line fee revenue of $7,061.3M and gross contract reimbursables of $3,226.9M within total revenue of $10,288.2M [17]. Colliers reports FY2025 revenues of $5,558.5M and Net Revenues of $4,866.5M [16].
Reported revenue less each company's own disclosed pass-through line: CBRE pass-through costs [15], JLL gross contract costs [9], Cushman and Wakefield service line fee revenue [17], Colliers Net Revenues [16]. Newmark is excluded: it discloses no comparable pass-through line.
On the reported basis Colliers is the smallest of the four; on the net basis it is still the smallest, but the ratio to JLL narrows from about five times to under two. The two rulers also change what a margin means. Cushman and Wakefield states an Adjusted EBITDA margin of 9.3% for FY2025, an increase of 46 basis points, measured against service line fee revenue rather than total revenue [18]. Any margin comparison that mixes the two denominators is arithmetic without meaning.
Growth and Margin, FY2025
Pinned company and peer facts for FY2025. Peer median revenue growth 12.3%; peer median operating margin 6.4%. Operating margins here are struck on each company's reported revenue, so the pass-through-heavy outsourcers sit structurally lower.
The ordering carries the denominator problem from the previous exhibit. CBRE, JLL and Cushman and Wakefield cluster between 4.2% and 4.4% because their reported revenue includes reimbursables that carry no margin; Colliers at 7.2% and Newmark at 8.4% carry less pass-through. WSP at 9.7% and Stantec at 8.8% are engineering firms on a third basis again.
Segment Economics
Colliers segmented information, $ millions, FY2025 [2] and FY2024 comparatives [19]. Segment Adjusted EBITDA is a company-defined measure that excludes nine categories of item and is struck before indirect operating costs as the company defines them.
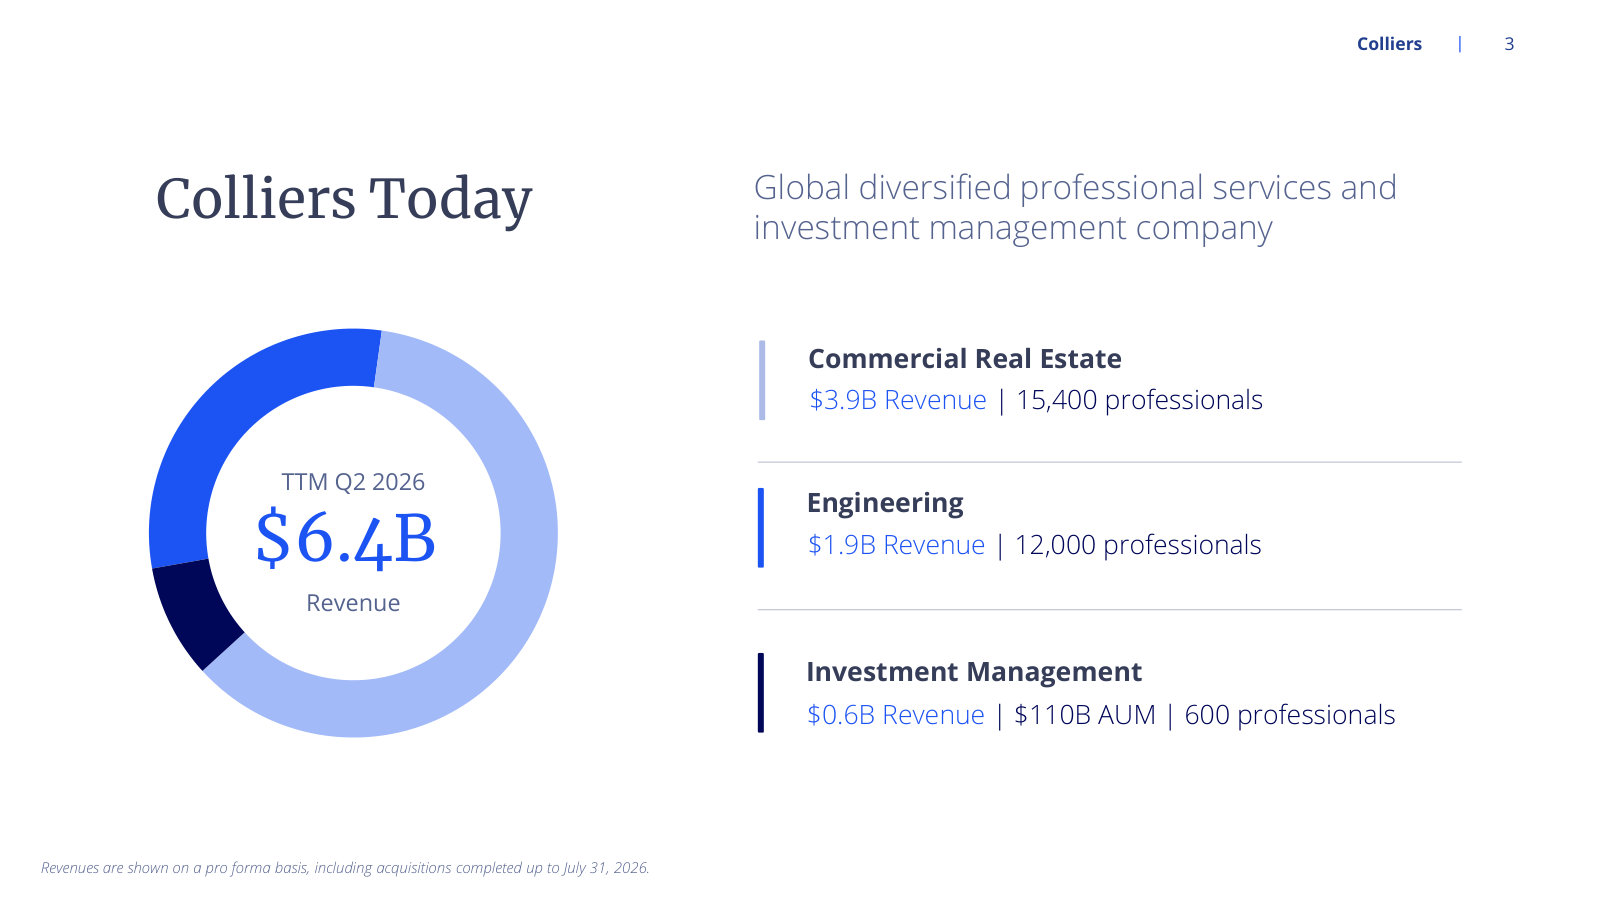
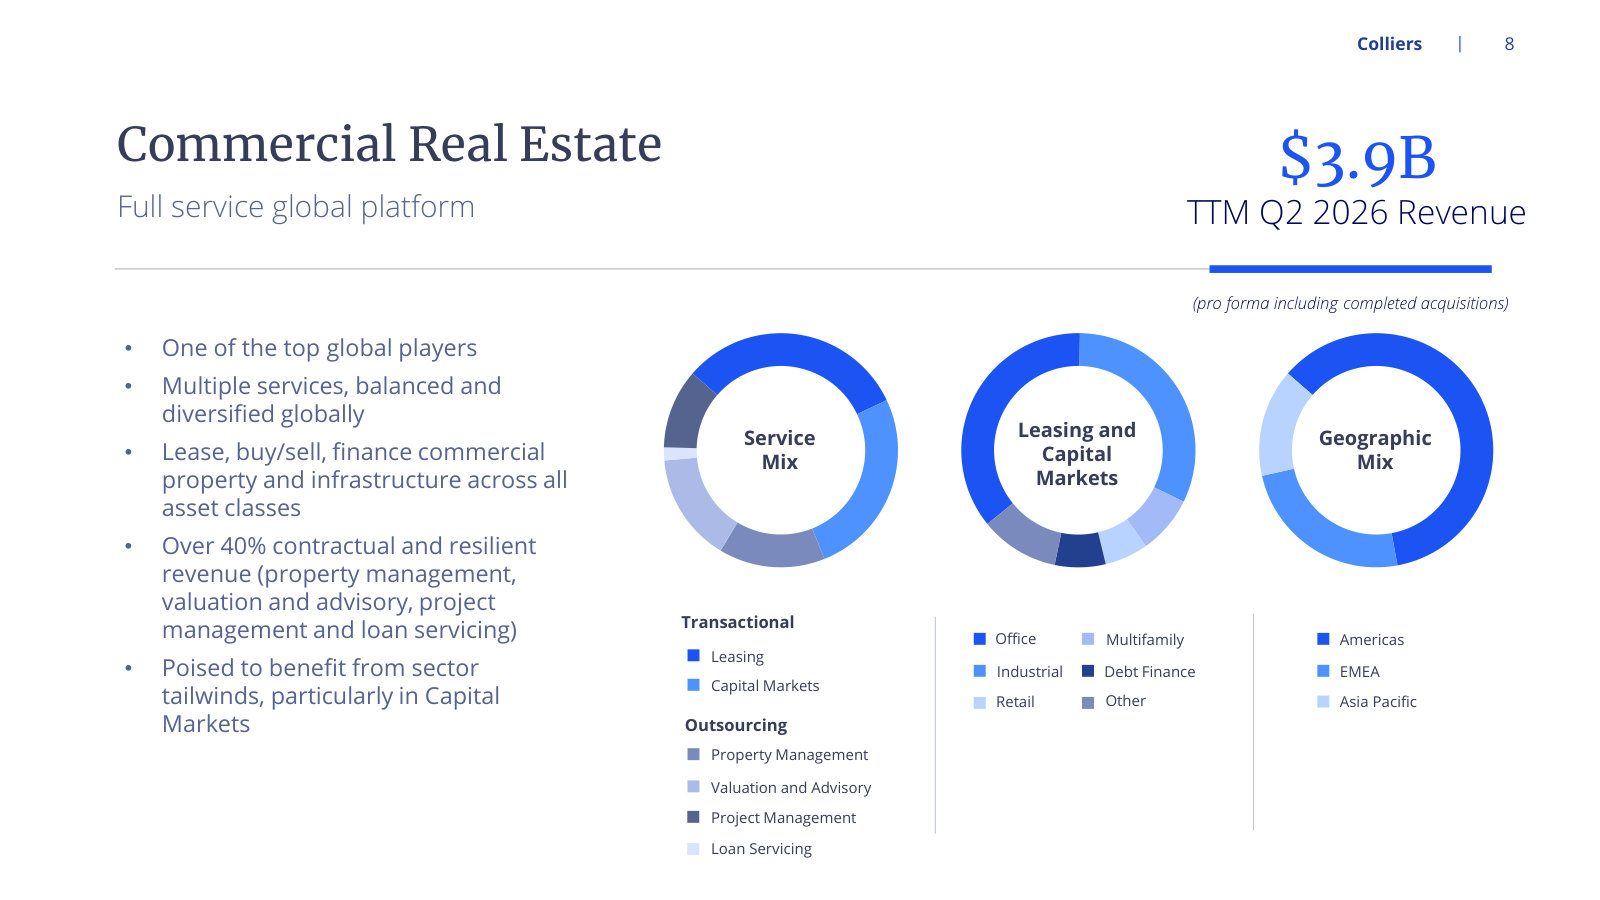
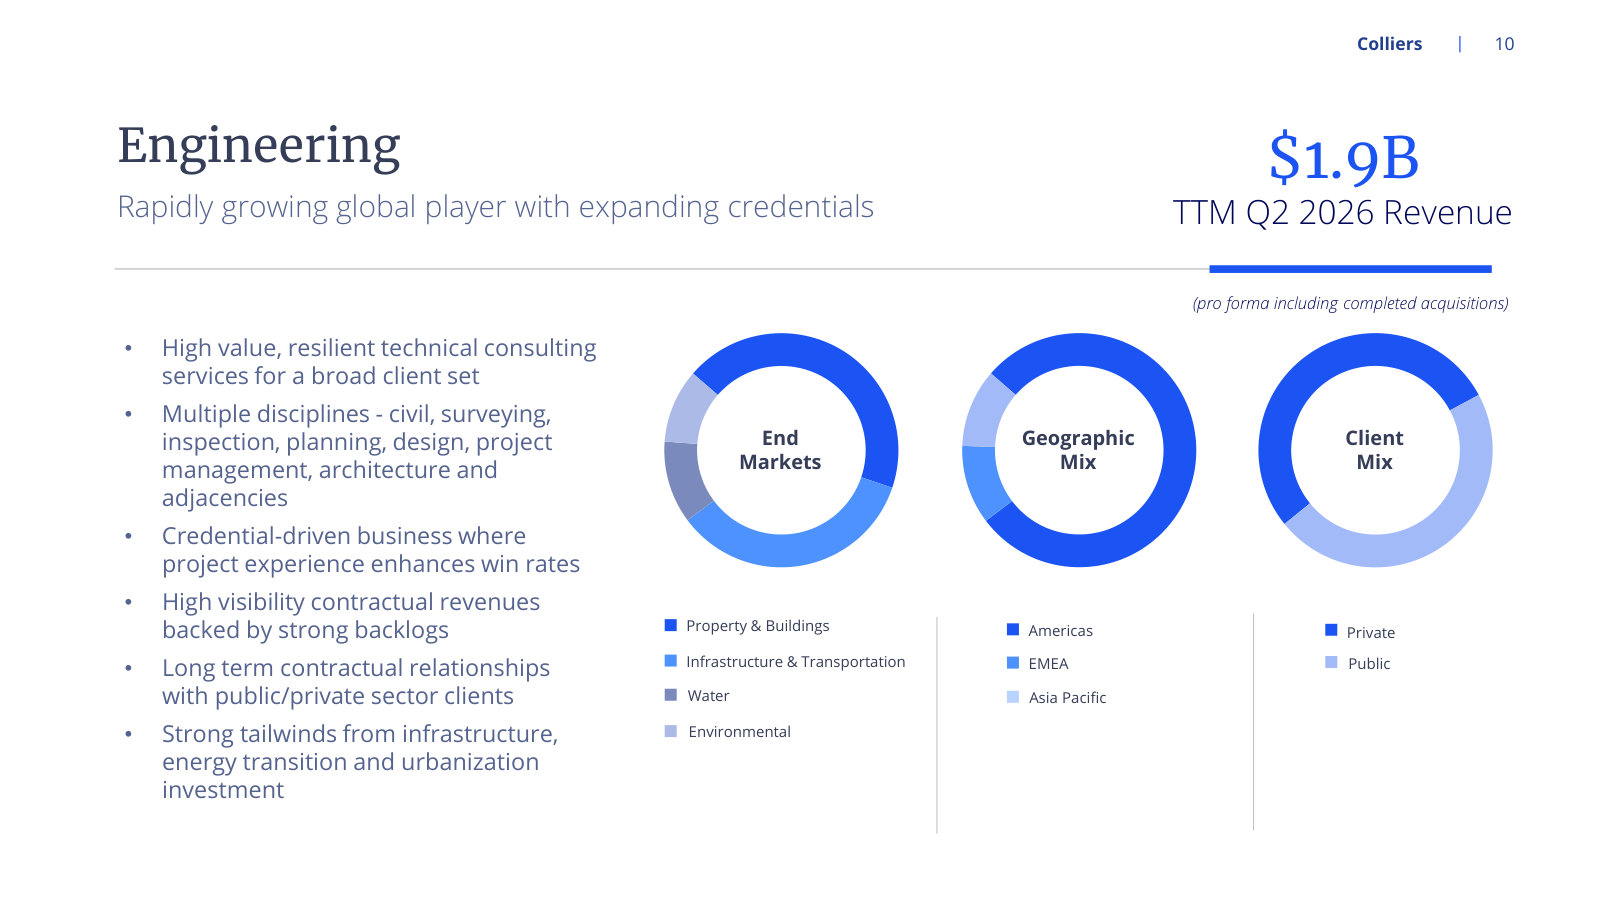
Investment Management earned $214.8M of Segment Adjusted EBITDA on $532.3M of revenue, roughly the same absolute contribution as Engineering on a third of the revenue. Within the Commercial Real Estate segment, Colliers disaggregates FY2025 revenue into Leasing $1,178.8M, Capital Markets $885.0M, Property management $545.5M, and Valuation and advisory $531.3M [20]. Cushman and Wakefield's equivalent split runs Services, Leasing, Capital markets and Valuation at 66%, 21%, 8% and 5% of revenue, but 51%, 30%, 12% and 7% of fee revenue, with the United States at 69% of 2025 revenue [10]. Colliers' August 2026 investor presentation puts 15,400 professionals behind a $3.9B Commercial Real Estate platform, 12,000 behind a $1.9B Engineering platform, and 600 behind Investment Management [21].
The Engineering Comparators
Millions in each company's own reporting currency; no common-currency series is disclosed, so the figures are not converted. WSP segment note [12], Stantec Note 33 [13], Colliers Note 27 [2].
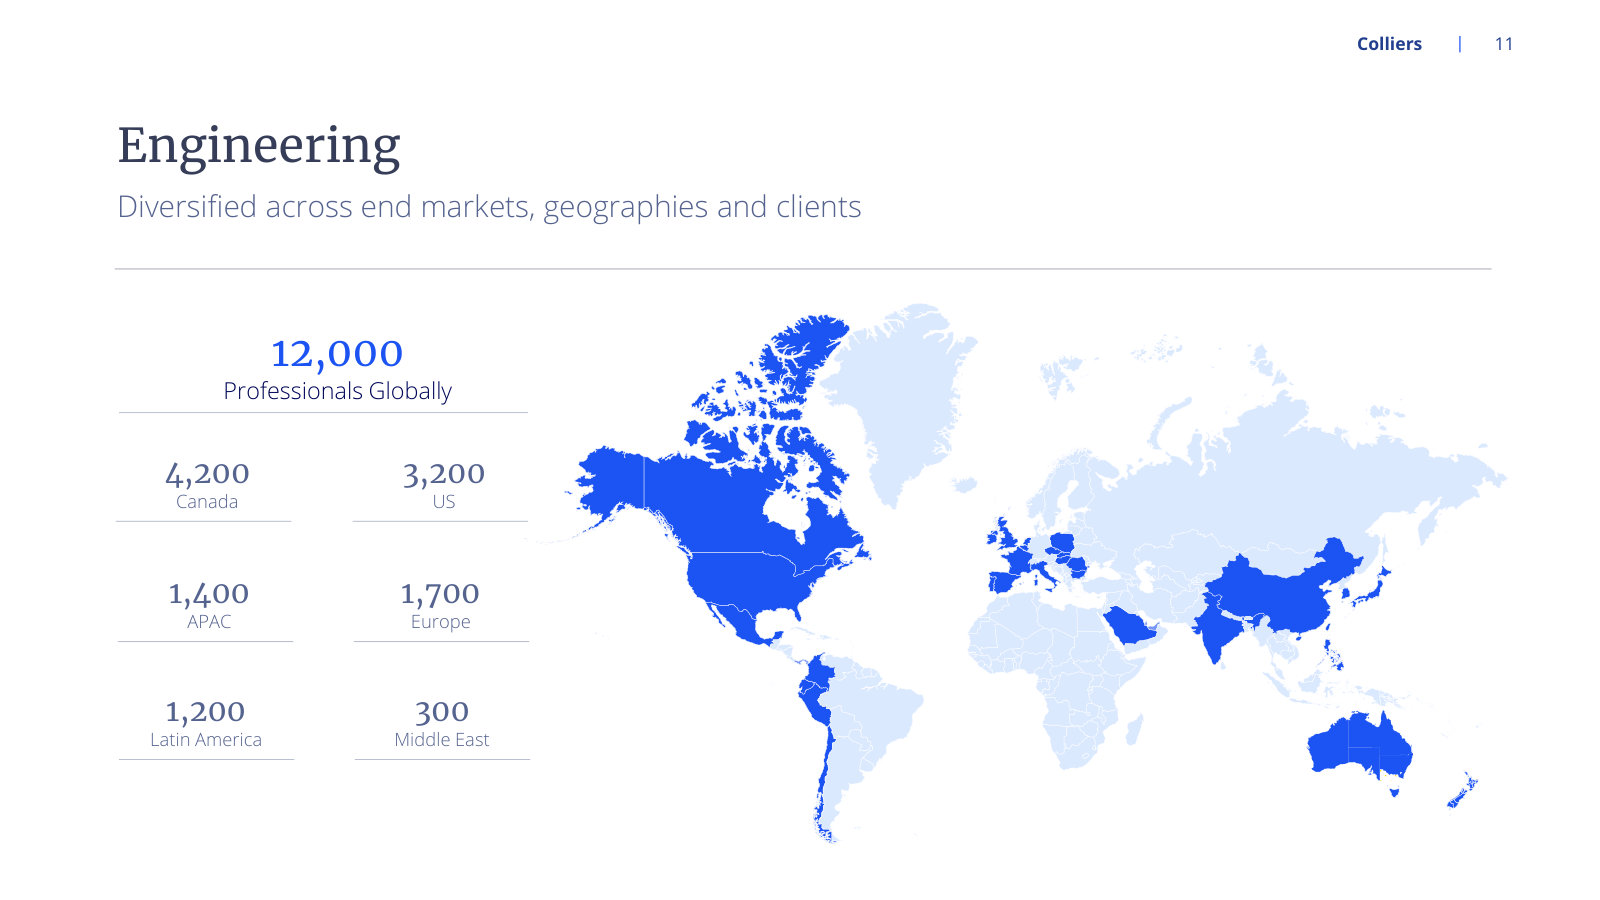
Three companies, three earnings definitions, two currencies. WSP measures segments on net revenues and Adjusted EBITDA by segment, with head office corporate costs held outside the segments entirely [12]; Stantec bridges gross revenue to net revenue to project margin, which sits above overhead rather than below it [13]. Both also report on geography rather than discipline, so the comparison to Colliers Engineering holds at the level of end markets and headcount, not at the level of margin. Colliers discloses 12,000 engineering professionals, with 4,200 in Canada, 3,200 in the United States, 1,700 in Europe, 1,400 in Asia-Pacific, 1,200 in Latin America and 300 in the Middle East [22].
What Rivals Say
Rival disclosures naming Colliers: JLL [6], CBRE [7], Cushman and Wakefield [4], Newmark [5].
Cushman and Wakefield's phrasing places Colliers outside the top three by its own count: the registrant describes itself as "one of the three largest global commercial real estate services firms" while listing Colliers as a competitor [4]. Newmark's list is the widest, running past the global firms to Eastdil Secured, Walker and Dunlop, Berkadia, Knight Frank, NAI Global, SitusAMC and Trimont — the specialists that compete for individual service lines rather than whole mandates [5]. No rival discloses a market share figure for Colliers or for itself.
Share and Pricing
Ordered oldest to newest. Colliers Q1 2024 call [23], Cushman and Wakefield Q3 2025 call [24], CBRE FY2025 10-K [25], JLL FY2025 10-K [26], JLL Q2 2026 call [27], Colliers Q2 2026 call [28].
Every share claim in that table is management characterization. None of the six companies publishes a measured share series, and the two most recent claims are not compatible with each other on their face: JLL's chief financial officer says the firm is "confident from our market data that we're gaining share" in capital markets [27], while Colliers' chief financial officer says "We have been winning share of market" and that Colliers "added more producers on a percentage basis than they have" [28].
The two firms describe opposite mechanics for the same outcome. JLL's chief executive states that "in our capital markets business we have been able to grow revenue significantly over the last two years without adding additional brokers", attributing the gain to platform productivity [27]. Colliers attributes its gain to headcount and books the cost: adding producers "has been a modest drag on our margins over the last few quarters as we ramp these folks up" [28]. Cushman and Wakefield takes the third position, hiring selectively and pairing it with deleveraging [24].
What is disclosed rather than characterized: Colliers grew FY2025 revenue 15% and net revenue 14%, of which internal revenue growth was 5% in local currency [29]. The distance between 15% and 5% is acquisition and currency, not share. On pricing, the only direct statements come from rivals' risk factors, and both point the same way: JLL cites "increasing commoditization of the services we provide and increasing downward pressure on the fees we can charge" [26], and CBRE states there is "no assurance that we will be able to compete effectively, to maintain current fee levels or margins" [25]. Neither quantifies the pressure.
Portfolios and Their Definitions
Colliers investor presentation [30] and [31]; CBRE FY2025 10-K [8]; JLL FY2025 10-K [32]; Newmark FY2025 10-K [33].
These numbers are not on one measuring stick, and Colliers says so. Its definition of assets under management covers "the gross market value of operating assets and the projected gross cost of development assets", including capital the funds have the right to call from investors, and the company states that "Our definition of AUM may differ from those used by other issuers" [34]. Fee-paying AUM of $55B against total AUM of $110B is the sharper number for revenue purposes, and Colliers also discloses 1,100 institutional limited partners with 87% participating in more than one fund [30].
On the servicing side the difference is scale, not definition. Newmark's primary servicing portfolio was $75.3B at 31 December 2025 against $67.4B a year earlier [33], roughly three and a half times the $21B Colliers shows [31]. Newmark describes that book as "a stable, predictable recurring stream of revenue to us over the life of each loan" that "includes significant prepayment penalties" [35]. Colliers carries risk against its own agency book: under the Fannie Mae Delegated Underwriting and Servicing programme its guarantee is typically up to one-third of any losses on loans originated [36].
How Clients Can Leave
CBRE [25], JLL [37], Cushman and Wakefield [38], Newmark [5], Colliers fund structures [39] and contract policy [40] [20].
The gap between the written term and the observed behaviour is the point of the table. JLL discloses that Workplace Management agreements "are typically three to seven years in duration" but that "most contracts can be terminated at will by the client upon a short notice period (usually 30 to 60 days)", and then adds that "a transition period of six to twelve-months is more common in our industry", that it "typically experience[s] a high renewal rate", and that "many of our largest contracts have been in place for more than a decade" [37]. Legal switching cost is near zero; practical switching cost is a two-quarter transition. Cushman and Wakefield's disclosure is harsher at the leasing end, where "some agreements related to our Leasing service line may be rescinded without notice" [38].
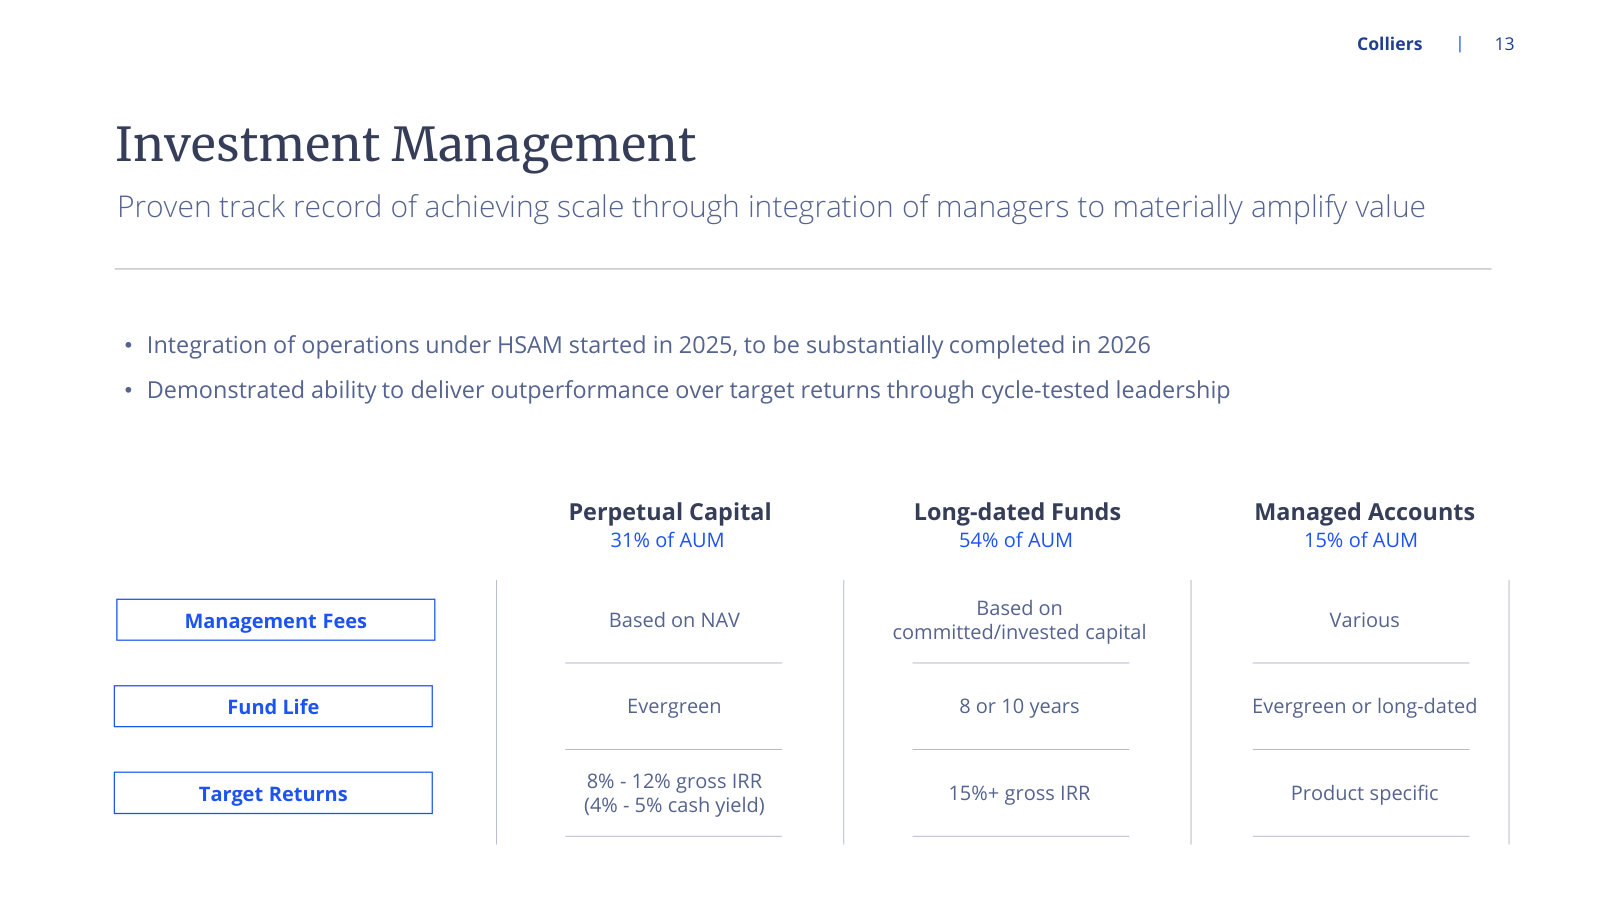
Colliers' own contractual duration sits mainly in Investment Management, where advisory fees are "primarily based on agreed-upon percentages of a fee base (committed capital, assets under management, invested capital, gross asset value or net asset value)" and loan servicing revenue is recognised over the contractual service period [41]. The fund ladder behind that — 31% perpetual capital, 54% long-dated funds on eight or ten year lives, 15% managed accounts — is the longest-dated contractual commitment the company discloses [39]. For the wider business, Colliers defines its resilient revenue as that "derived from Engineering, Outsourcing and Investment Management service lines" carrying "medium to long-term duration revenue streams that are either contractual or repeatable in nature" — a company definition, not a contractual term [34].
The other portability question is people rather than paper. Cushman and Wakefield states that "our industry is subject to a relatively high turnover of brokers and other key revenue producers" [42], which is the mechanism behind the producer-hiring contest recorded above. Colliers entered its most recent reported quarter with double-digit revenue growth across all three platforms and a reaffirmed outlook [43].
The primary record for Colliers in this corpus runs from a March 2015 Form 40-F registration statement filed by FirstService Corporation, the predecessor whose separation created Colliers International Group Inc. [1], through the second-quarter 2026 results release of July 2026 [2]. Continuous coverage — transcripts, audited statements, results releases and decks together — begins with the third-quarter 2021 call and is dense from there.
Four breaks organise that record. In April 2021 the company bought out the arrangement that had paid its founder a share of value creation since 2004, and set a date for ending its dual-class structure. In late 2021 it announced a five-year plan built around doubling profitability and shifting the earnings mix toward recurring work. In 2022 it spent more on acquisitions in a single year than in the prior two combined, then in 2023 met a transaction downturn that cut Adjusted EPS by roughly a quarter and stopped share repurchases for three consecutive years. From 2024 onward it rebuilt through engineering, funding the largest of those deals with equity and, in 2026, with a step-up in leverage. Across the same span the reporting segments were redrawn three times.
Who runs and controls the company today sits in People; the named-rival and market-share record sits in Competition. This tab holds the dated record of what was said, what was bought, and what arrived.
The arc in dates
Revenue as presented by the company, USD millions, from the investor presentation dated August 2026 [3]. The 2022 to 2025 figures agree with the pinned company facts.
Adjusted EBITDA as defined by the company, USD millions, same source [3]. The measure excludes nine categories of item, and the list of nine was itself restated in FY2025 [4].
Dated beats, oldest first. Sources in order: 2015 registration statement [1]; FY2021 annual report on the incentive settlement [5] and on 2021 acquisitions [6]; the Q3 2021 call for the plan [7]; FY2022 annual report on disposals [8], acquisitions [9] [10] and repurchases [11]; FY2023 annual report on the notes [12], the unused bid [13] and segments [14]; the February 2024 prospectus supplement [15]; FY2024 annual report on Englobe [16] [17] and segments [18]; FY2025 annual report on 2025 deals [19] [20], segments [4] and subsequent events [21]; the Q1 2026 release on the realignment [22]; and the August 2026 deck on leverage [23].
What was promised and what arrived
Colliers gives annual consolidated guidance on three measures — revenue growth, Adjusted EBITDA growth and Adjusted EPS growth — sets it on the fourth-quarter call in February, and revises it during the year. The measurement basis is the same in every case: full-year growth against the prior full year, on company-defined Adjusted EBITDA and Adjusted EPS, with local-currency growth disclosed separately. The company does not publish a year-end reconciliation of outcome against guidance.
Amounts in USD millions except per-share figures. Guidance from the Q4 2021 call [24], the Q4 2022 call [25], the Q3 2023 call [26], and the results releases for Q4 2023 [27], Q3 2024 [28], Q4 2024 [29], Q2 2025 [30], Q3 2025 [31], Q4 2025 [32] and Q2 2026 [2]. Outcomes from the FY2025 results release [33], the Q2 2026 release [34], the FY2023 outcome line carried in the Q4 2023 release [27] and the August 2026 deck series [3]. Growth percentages against prior year are computed from those reported levels.
Two rows repay a second look. In FY2024 the February guidance for Adjusted EPS was plus 10 to 20 percent and the year delivered plus 7.5 percent; the number landed inside the range only because the range was lowered twice, in August for the Englobe contribution and again in November. In FY2025 the raised August guidance called for mid-teens Adjusted EBITDA growth and mid to high-teens Adjusted EPS growth, and the reported outcome was 13.7 percent and 14.4 percent.
Revisions themselves carry the reasons the company gave at the time.
Revision log with the reason given in the same document. Sources: Q1 2023 call [35]; Q3 2023 call [26] and release [36]; Q2 2024 release [37]; Q3 2024 release [28]; Q1 2025 release [38]; Q2 2025 release [30]; Q2 2026 release [2]. The FY2024 outlook was first maintained in May 2024 before the August revision [39].
The five-year plan
On November 2, 2021 the company set a five-year target in two parts. Jay Hennick, Global Chairman and Chief Executive Officer, told the third-quarter call: "Over the next five years, we will strive to double our profitability and generate more than 60% of our Adjusted EBITDA from recurring services." [7]
Three months later, on the fourth-quarter 2021 call, the same plan was described with a different second number: "The goal was to double our profitability and generate more than 65% of our EBITDA from recurring revenue streams over the coming five years." [40] The threshold moved from 60 to 65 percent, and the measure from Adjusted EBITDA to EBITDA, without the change being flagged.
Enterprise 2025 is named in four calls in this corpus and appears for the last time on the second-quarter 2023 call, as a plan the company "continued to make progress toward" [41]. No call, release, annual report or deck in the corpus scores the plan against its two stated targets at the end of the five years.
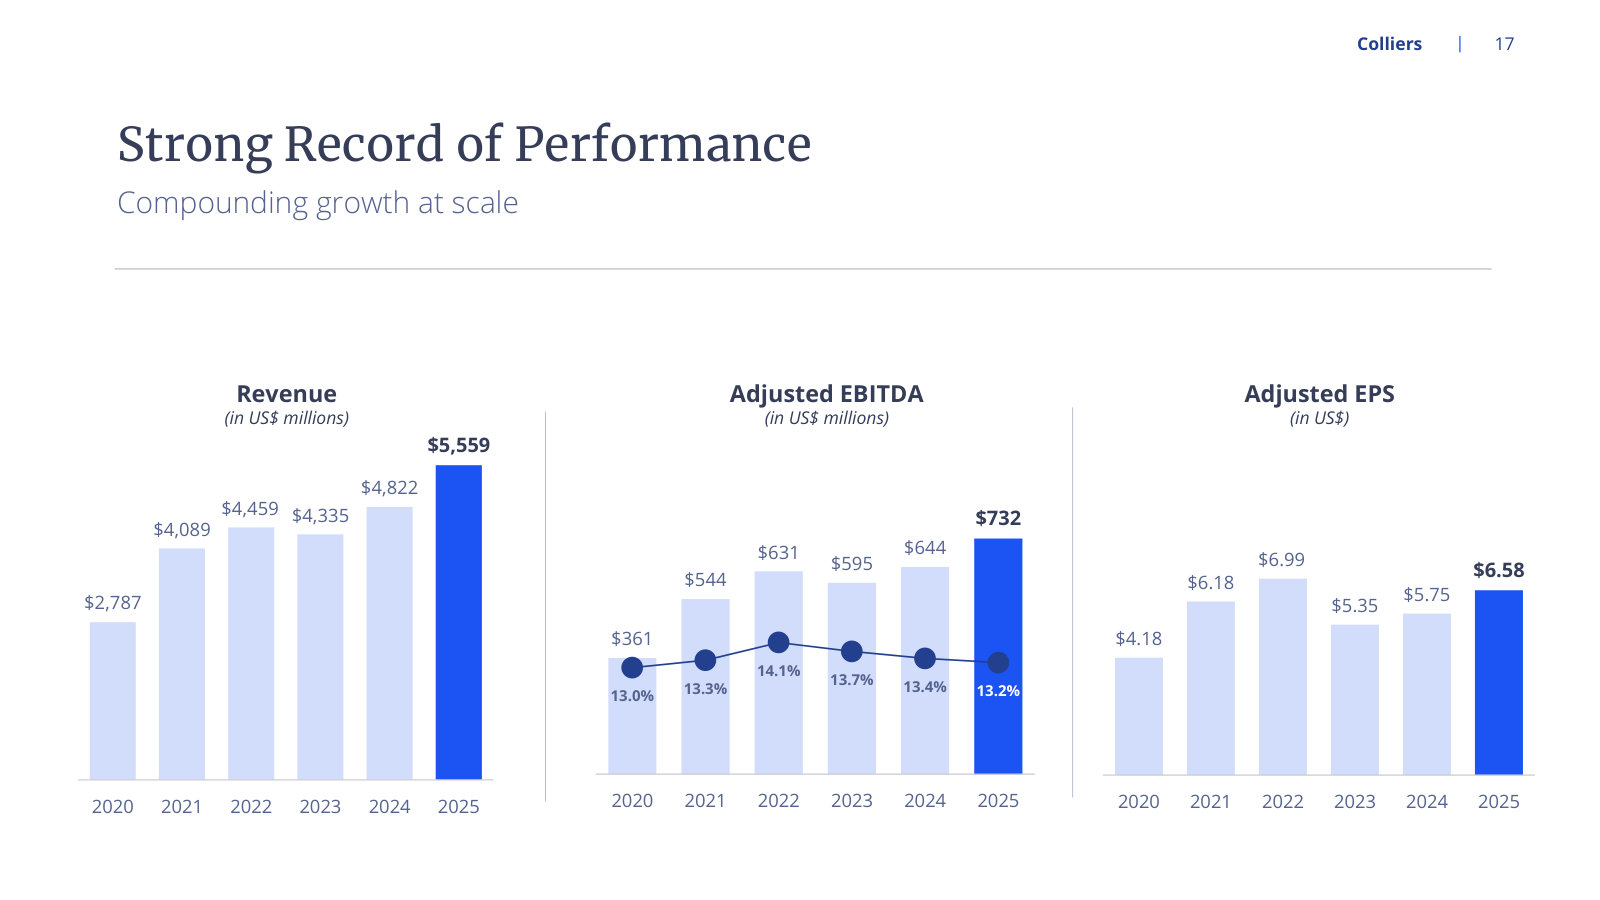
The record nonetheless allows the arithmetic. Adjusted EBITDA was 361 million in 2020 and 732 million in 2025, a factor of 2.03; Adjusted EPS over the same span went from 4.18 to 6.58, a factor of 1.57 [3]. Which of those measures "profitability" referred to is not specified in the launch remarks.
The mix target moved with its vocabulary. In November 2021 the claim was "more than 50% of our revenues coming from higher-value recurring revenue streams" [7]. In February 2023: "Earnings from high-value recurring revenues now make up about 58% of our pro forma EBITDA." [42] By February 2026 the word had changed: "Today, more than 70% of our earnings come from these resilient businesses, approaching 75% once recent acquisitions are included." [43] The deck defines the replacement measure precisely — the share of Adjusted EBITDA from Engineering, Outsourcing and Investment Management, on a trailing twelve-month basis incorporating the expected full-year impact of acquisitions [44] — but it is not the measure named at launch, and the corpus contains no bridge between the two.
Capital allocation
Total purchase consideration per the acquisitions note in each annual report, USD millions, rounded: FY2021 [6], FY2022 [10], FY2023 [45], FY2024 [17], FY2025 [20]. The 2026 bar is announced rather than completed consideration: four Engineering deals at 39.8 million plus Ayesa at approximately 700 million [21]. The pinned company facts record cash acquisitions of zero for FY2022 through FY2025, which the filed notes contradict.
Capital-allocation ledger, USD millions unless stated. Acquisition detail and consideration from the acquisitions notes cited above and the FY2022 narrative [9], FY2024 narrative [16] and FY2025 narrative [19]. Disposals [8]; repurchases [11]; the unused 2023 bid [13]; convertible notes [12]; share issuance [46] and its pricing [15]; dividends and distributions for 2021 [57], for 2022 and 2023 [47] and for 2024 and 2025 [48]; the Ayesa objective as stated on the Q4 2025 call [43]; leverage [23]. Disclosed outcome per deal — return on the consideration paid — is not published for any acquisition in this record.
Three features of that ledger are worth stating plainly, because the chapters will want them.
The single repurchase episode is 2022. Colliers bought 1,426,713 Subordinate Voting Shares for 165.7 million and has not repurchased since; the FY2023 cash-flow statement carries the line at nil against the prior year's 165.7 million [47], and the FY2025 statement carries no repurchase line at all for 2024 or 2025 [48]. A bid for up to 4,000,000 shares announced on July 17, 2023 ran to its July 19, 2024 expiry without a share being bought [13].
Distributions to non-controlling interests exceed common dividends in every year of the record, by a factor of roughly five in 2023 and roughly 4.7 in 2025 [47] [48]. The partnership model that puts operating leaders into the equity of the businesses they run is visible in the cash-flow statement as a standing claim ahead of the common dividend.
Equity has been a funding source rather than a return channel. The April 2021 incentive settlement issued 3,572,858 shares, the June 2023 note redemption converted into 4,015,720 shares, and the February 2024 offering added 2,479,500 more; diluted shares outstanding went from 43.92 million in FY2022 to 51.08 million in FY2025. The February 2024 offering priced 2,479,500 shares at USD 121.00 for gross proceeds of USD 300.0 million [15].
Leverage at the dates the company disclosed it. September 2023 from the Q3 2023 call [26]; 2025 and 2026 points and the balance-sheet amounts from the August 2026 deck [23]. The covenant ceiling was temporarily raised from 3.5x to 4.0x for up to four quarters after any acquisition above 200 million, effective with the February 20, 2026 amendment [21].
Definitions that moved
Definition changes and their effect. Segments: FY2023 [14], FY2024 [18], FY2025 [4], Q1 2026 [22]. Adjusted EBITDA exclusions: the same FY2024 and FY2025 notes. Target language: Q3 2021 [7], Q4 2021 [40], deck definitions [44]. Net revenues: FY2025 results release [33] and the deck reconciliation [49]. Free cash flow: deck [50], against the pinned company facts.
How the explanation changed
Two threads in this record are told more than once, and the telling moves.
The cause of the transaction downturn. In November 2022 the softness was attributed to external conditions and framed as contained: capital markets had "been impacted by higher interest rates, availability of capital and geopolitical uncertainties" [55], while diversification was "demonstrating that the Colliers diversified services model is more balanced and more resilient than ever" [56]. In May 2023 the cause was new and specific: "Since then, a significant banking crisis has occurred, availability of credit has tightened further, and the level of uncertainty around asset valuations has increased, causing us to revise our outlook for the year." [35] By February 2024, Chris McLernon, Chief Executive Officer of Real Estate Services, framed it as duration rather than event: "we've had 18 months of a really challenging period for capital markets." [51] The recovery date moved with it. February 2023 expected "a return to year-over-year growth in the second half" of 2023 [25]; November 2023 expected the seasonally strongest fourth quarter to be down year over year [36]; February 2024 expected challenging conditions in the first half of 2024 "followed by year-over-year growth in the second half" [27]. Each account is defensible on its own date; read in sequence they describe a recovery that kept being one half-year away.
Investment Management fundraising. In November 2024 the shortfall was explicit: capital markets revenue was "exceeding our expectations", while "fundraising fell below expectations, reflecting a trend seen across the industry" [52]. That shortfall was the stated reason for cutting the 2024 Adjusted EBITDA and Adjusted EPS ranges in the same month [28]. Three months later the same year's total was characterised differently: "We raised $1.3 billion of new capital commitments during the quarter, bringing full-year fundraising to $3.8 billion, as we expected." [53] The 2025 total drew the same construction — 5.3 billion for the full year, "in line with our expectations" — alongside a 2026 target of 6 to 9 billion [54]. The corpus does not contain a published fundraising target for 2024 against which the 3.8 billion can be checked, which is why the November and February descriptions cannot be reconciled from the record alone.
What the record does not contain
The Colliers annual reports in this corpus are the Form 40-F financial statements only. They carry the notes — acquisitions, capital stock, segments, subsequent events — but not an Item 1 business description, risk factors or management's discussion and analysis. Those sit in the separately filed Annual Information Form and the accompanying management discussion document, neither of which is ingested here. Narrative about strategy therefore comes from calls, releases and decks rather than from the annual filing.
Four further gaps bear on the layers above. No document scores Enterprise 2025 against its two stated targets. No acquisition in the record carries a disclosed return against the consideration paid, and no document in the corpus states a required return threshold for acquisitions. The 2024 Investment Management fundraising target is absent, so the "as we expected" characterisation cannot be tested. And the pinned company facts record cash acquisitions of zero for FY2022 through FY2025 and no buyback entry after FY2023, both of which the filed statements contradict; the figures used here are the filed ones.
Colliers is run by the person who founded it. Jay S. Hennick has been a director since 1988, is both Chair of the Board and Global Chairman and Chief Executive Officer, and holds every Multiple Voting Share through a private company he controls [1]. His services are not supplied under an employment contract but under a management services agreement with Jayset Management CIG Inc., a corporation he controls. The dual-class structure that carries his votes has a termination date written into it, and a cash incentive plan running to January 1, 2029 sits on top of it.
This page sets out how control, the board, the operating roster and the pay formulas stand today, with the dates attached. The multi-year record of what management said and then did belongs to History; the operating model those people run belongs to Business.
Votes and economics
Two classes of common shares are outstanding. Subordinate Voting Shares carry one vote; Multiple Voting Shares carry twenty [2]. As of March 26, 2026 there were 49,778,127 Subordinate Voting Shares and 1,325,694 Multiple Voting Shares issued and outstanding, and all of the Multiple Voting Shares were held directly or indirectly by Mr. Hennick and Henset Capital Inc. [3].
Share counts as of March 26, 2026; votes derived from the one-vote and twenty-vote entitlements in the capital stock note. [4]
The company states the same split directly: as of March 26, 2026 the Subordinate Voting Shares represented approximately 97.41% of total issued and outstanding shares and approximately 65.25% of the voting power [5]. Two years earlier the same disclosure read 97.21% of shares and 63.56% of the voting power as of February 16, 2024 [6]. The drift comes from share issuance, not from any change in the class: the Multiple Voting Share count has been unchanged at 1,325,694 since at least December 31, 2020, while Subordinate Voting Shares went from 38,863,742 at the end of 2020 to 49,778,127 at the end of 2025 [7].
The company's governance extract records the personal holding as 10.7% of Common Shares [8]. The principal-holders table in the 2026 management information circular, which is the extract's stated source but is not itself among this report's linked source files, puts it differently: 10.7% is Mr. Hennick's share of the Subordinate Voting Share class alone. On that table he holds 5,322,987 Subordinate Voting Shares plus all 1,325,694 Multiple Voting Shares — 13.0% of total Common Shares and 41.7% of total votes. The arithmetic checks against the class counts above, so the governance extract's label appears to be the looser of the two.
Before the February 2024 equity issue, the same disclosure put Mr. Hennick and the Multiple Voting Shareholder at approximately 43.62% of the voting power [9]. That issue sold 2,479,500 Subordinate Voting Shares for gross proceeds of $300,019 thousand on February 28, 2024 [10].
The clock on the dual-class structure
The two-class structure is not open-ended. Under the New Trust Agreement entered into on April 16, 2021, the Multiple Voting Shares convert into Subordinate Voting Shares one for one, for no consideration or premium, on the earliest of three events [11].
Conversion triggers as set out in the New Trust Agreement summary. [12]
The fixed date was set in 2021, when shareholders settled the original management services agreement and its long-term incentive arrangement. That transaction, approved by 95% of disinterested shareholders on April 16, 2021, paid Mr. Hennick's entity $96,200 thousand in cash and issued 3,572,858 Subordinate Voting Shares at $106.40 per share, and it established an orderly timeline for the elimination of the dual class voting structure by no later than September 1, 2028 [13]. On the circular's count Mr. Hennick holds 6,648,681 shares against the 4,000,000 floor, leaving 2,648,681 shares of headroom before the first trigger would fire.
Until conversion, holders of the subordinate class have two contractual protections. A take-over bid for the Multiple Voting Shares makes each Subordinate Voting Share convertible into a Multiple Voting Share unless an identical concurrent offer is made, and the Trust Agreement blocks a sale of Multiple Voting Shares under a bid at more than 115% of the then current market price of the Subordinate Voting Shares without a matching offer [14]. The Trust Agreement itself cannot be amended or waived without two-thirds of the votes cast by Subordinate Voting Share holders, including a simple majority excluding anyone who owns, is affiliated with an owner of, or has agreed to buy Multiple Voting Shares [15].
The board
Ten directors were elected at the annual and special meeting held March 31, 2026 [16]. Eight are designated independent; the two who are not are Mr. Hennick, as a member of management, and Katherine M. Lee, because a family member is an employee of the company's external auditing firm — a status the board describes as expected to be temporary [17]. Ms. Lee chairs the Compensation Committee.
Board roster, ages and committee seats as at March 31, 2026, ordered by length of service. [18]
There is no separation of the chair and chief executive roles. The board instead designates an independent Lead Director, John (Jack) P. Curtin, Jr., and requires one whenever the chair is not independent [19]. The Audit and Risk Committee is fully independent, Mr. Sutherland is the designated audit committee financial expert, and Mr. Sullivan joined it on December 2, 2025 in place of Mr. Waitzer [20]. Nine of the ten directors are stated to be free from any relationships with Mr. Hennick [21].
Years computed from the first-elected year in the governance extract, whose tenure range runs from 1988 to December 2024. [22]
Three of ten directors are women, eight are based in Canada and two in the United States [23]. The retirement policy is a review rather than a cap: the board reviews each director's continued service on reaching age 75 and on each anniversary thereafter, with a written resignation tendered for the Governance Committee's consideration [24]. Mr. Curtin is 75, Mr. Sutherland 74 and Mr. Waitzer 72.
Director pay comes from the 2026 circular rather than from a linked filing. Each non-management director received a US$100,000 annual retainer in 2025, with US$50,000 more for the Lead Director, US$30,000 for the Audit and Risk chair and US$15,000 for each other committee chair, plus a US$200,000 deferred share unit grant. Aggregate cash fees were US$1.01 million, and five of the nine took deferred share units in lieu of 100% of their cash retainer. Under a deferred share unit plan approved in September 2024, directors no longer receive option grants; each director must hold shares and units worth at least US$500,000, and all currently comply. Directors still hold legacy options — most hold three tranches of 11,250 at strikes of $93.18, $106.98 and $138.12.
Operators
The executive roster changed in four places across fifteen months, and two of the changes doubled up existing officers rather than adding new ones.
Dated leadership changes, oldest first, drawn from the incentive-plan note, the company news record and the Q1 2026 call. [25] [26] [27]
On the May 5, 2026 call Mr. Hennick described the change as strengthening the leadership team to capture growth in engineering, appointing Mr. Mulamoottil as chief executive there and Mr. Mayer as chief executive of the commercial real estate business [28]. By the July 30, 2026 call Mr. Mayer was introduced as Chief Financial Officer and Chief Executive of Colliers Commercial Real Estate [29]. One officer therefore carries the group finance function and the largest operating segment at the same time. Mr. Mayer has been chief financial officer across the whole transcript record in this corpus, back to the third-quarter 2021 call.
Succession depth below the chief executive is not disclosed in any linked filing. The circular describes an annual leadership review at each regional operation and for the executive leadership, with a successor list refreshed and reviewed by the board annually, but names no successor and sets no timetable.
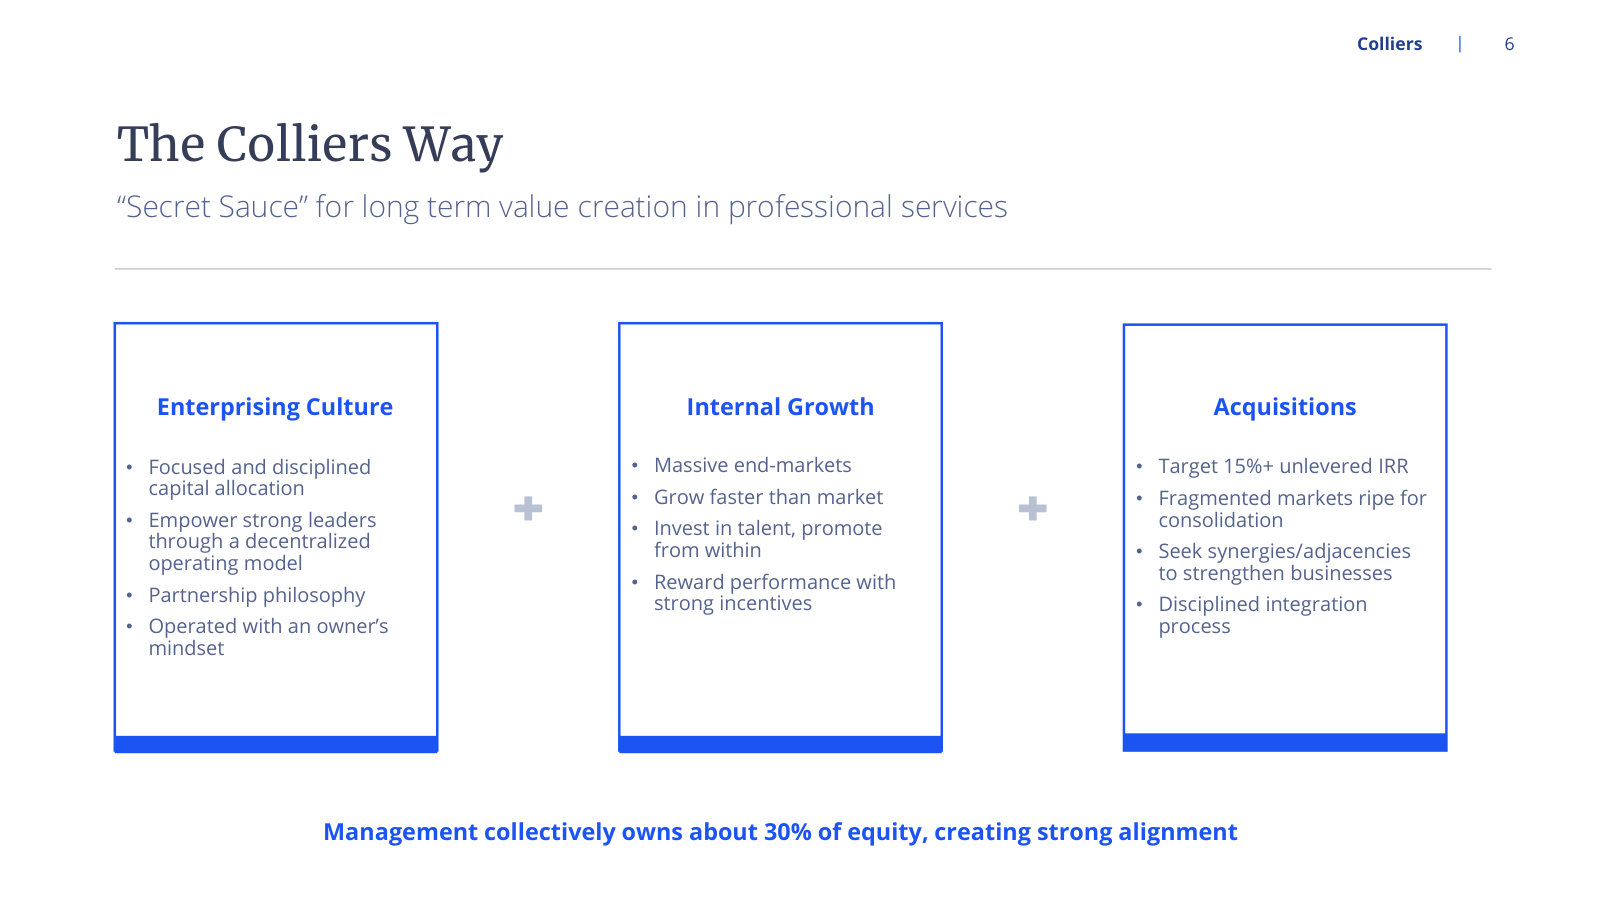
The company presents partial ownership by operators as the mechanism that holds leaders in place. Its standard description is that the partnership philosophy empowers exceptional leaders, preserves the entrepreneurial culture and ensures meaningful inside ownership [30]. On the Ayesa completion Mr. Hennick put a number to it: more than 700 of the company's operators are partners in the engineering business [31]. The balance-sheet counterpart of those partnerships appears further down this page.
What the named officers were paid
Named executive officer compensation for fiscal 2025, in US dollars, highest total first. [32]
Two features stand out from the table itself. The chief executive received no stock or option awards at all; his $5.35 million total is salary plus an annual bonus more than twice his salary. And the highest-paid officer in fiscal 2025 was Zachary Michaud, at $11.18 million, of which $9.93 million was a stock award granted in the year he moved from Co-Chief Investment Officer of Colliers to Managing Partner and Global Chief Financial Officer of Harrison Street Asset Management [33]. No chief-executive-to-median-employee pay ratio is published; as a Canadian issuer filing under Form 51-102F6 and an SEC foreign private issuer, Colliers is outside the rule that would require one [34].
The annual bonus formula behind those numbers is in the circular, not in a linked filing. Bonus equals base salary multiplied by the percentage growth rate in adjusted earnings per share over the preceding year, multiplied by an individual multiplier; the growth input is capped at 31.25% and a floor of 35% of base salary is available at the committee's discretion. For 2025 the multiplier ranges and selections were: Mr. Hennick 13.2 to 22.8, target 15.6, awarded 15.0; Mr. Mayer and Mr. McLernon 7.8 to 12.6, target 9.0, awarded 9.0; Mr. Mulamoottil 6.6 to 11.4, target 7.8, awarded 11.4; Mr. Michaud 6.6 to 11.4, target 7.8, awarded 7.8 and prorated to October 1, 2025. No discretionary bonuses were paid in 2023, 2024 or 2025. Under the management services agreement any annual increase in the chief executive's base salary is, absent Jayset's consent, not less than 5%; for 2025 Mr. Hennick waived an increase, while the other officers received 3% to 10%.
The chief executive incentive
Mr. Hennick is not eligible for the stock option plan. On October 1, 2024 the management services agreement was extended to January 1, 2029 and a performance-based long-term incentive plan was created, granting him 428,174 cash-settled performance stock units subject to performance vesting conditions during the period ending January 1, 2029. If earned, the company owes a one-time cash payment equal to the vested units multiplied by the twenty-day volume-weighted average trading price of the Subordinate Voting Shares. The units cannot be share settled and give him no shareholder rights [35].
Unit counts and vested status are from the fiscal 2025 statements; the market-capitalization thresholds come from the 2026 circular, which is not among this report's linked source files. Gap measured against a market capitalization of 6.51B at 2026-09-28. [36]
Three things about the ladder are worth stating precisely. The measure is absolute market capitalization on a thirty-trading-day average, defined to include Subordinate Voting Shares issuable on in-the-money vested convertibles — not per-share value, so shares issued to fund acquisitions count toward the target. The first tier, satisfied as at December 31, 2024, stays satisfied: as at December 31, 2025 the performance vesting criteria related to 107,043 units had been met, and no further tier had been [37]. And the market capitalization of 6.51B at 2026-09-28 sits below the first threshold, 20.6% off the three-year high, with the remaining three tiers between 42% and 89% above the current level.
The accounting reflects the same position. Expense related to the units was $12,813 thousand in 2025 against $13,438 thousand in 2024; estimated fair value at December 31, 2025 was $41,039 thousand with $14,788 thousand unrecognized; $26,251 thousand sits in Other liabilities [38]. The fair value is a Monte Carlo estimate using a 3.5% risk free rate, a 5.0% discount rate, 27.5% volatility and a 3.00-year remaining life [39].
Termination outcomes are set out in the circular. A discontinuance of Jayset's services costs 300% of the three-year average of base fee and annual bonus, put at US$10.4 million had it occurred on December 31, 2025. Vested units worth US$15.7 million would settle on a change of control or a not-for-cause termination; on a for-cause termination they may be forfeited entirely depending on the grounds. If Jayset terminates voluntarily, unvested units are forfeited and the 107,043 vested units still settle on the January 1, 2029 timeline. Mr. McLernon's without-cause entitlement was put at US$2.9 million on the same date. Mr. Michaud received no severance or termination payment on his October 1, 2025 transition.
Options, strikes and dilution
Everyone other than the chief executive is paid long-term in options. Options are granted at the market price on the day immediately prior to grant, vest over four years and expire five years from grant; all shares issued are new shares [40].
Option counts and weighted average exercise prices from the stock-based compensation note; spread measured against the 127.49 close on 2026-09-28. [41]
The ladder has been climbing toward the share price rather than away from it. Grants went out at $151.34 in 2024 and $142.85 in 2025; exercises came off at $77.50 and $90.27 respectively; the weighted average strike rose from $101.73 to $125.11 over two years while the share price fell back to $127.49. The disclosed exercise price range at December 31, 2025 was $91.84 to $151.62, so part of the book is already above the current price. Of the 3,420,780 options outstanding, 1,493,294 were exercisable at a weighted average $115.68, and 348,825 remained available for future grant [42]. Stock-based compensation expense on these awards was $35,347 thousand in 2025 against $32,603 thousand in 2024, with $54,134 thousand unrecognized.
The realized side is disclosed for the year: 493,145 options were exercised in 2025 for $44,518 thousand of cash received and $25,769 thousand of intrinsic value [43]. The circular attributes 142,000 of those exercises to three named officers: Mr. Mayer 54,000 options for US$2.76 million of notional gain, Mr. Mulamoottil and Mr. Michaud 44,000 each for US$1.77 million apiece. No open-market sales by officers or directors are disclosed in any source read for this page, and the trading policy prohibits short sales, exchange-traded derivatives, hedging or monetization transactions, and resale within three months of an open-market purchase.
Diluted share count rose from 43.92M in FY2022 to 51.08M in FY2025, a 1.8% increase in FY2025 alone. The FY2025 reconciliation shows 50,784,136 basic and 51,083,417 diluted shares. [44]
Three further claims on the share count sit outside the option plan. The company entered subsidiary stock-based compensation plans on October 1, 2025, granting awards in the Investment Management segment that vest on three to five years of service and settle in stock of the subsidiary; because that stock is redeemable by the holder the awards are liability-classified, valued on a fixed multiple of subsidiary earnings with a 25% discount for forfeiture risk and redemption limits, and they cost $7,460 thousand in 2025 with $36,534 thousand unrecognized [45]. The redeemable non-controlling interests carry a put and call at a formula price: the redemption amount at December 31, 2025 was $1,068,617 thousand, and if all put or call options were settled in Subordinate Voting Shares approximately 7,300,000 shares would be issued — about 14% of the current count [46]. Working the other way, on May 13, 2026 the company obtained approval to repurchase up to 4.3 million Subordinate Voting Shares, roughly 10% of the public float, through May 14, 2027 [47].
The circular adds the plan-level overhang: 3,420,780 options outstanding equal 6.7% of common shares, 338,825 remain available, and shareholders were asked at the March 31, 2026 meeting to add 1,500,000 more, which would take outstanding plus reserved to 10.3%. Annual burn rate was 1.3% in 2025, 1.4% in 2024 and 1.8% in 2023.
Related-party facts
Related-party items, in thousands of US dollars where amounts are stated, from the 2021 and 2025 statements and the February 2024 prospectus supplement. [48] [49] [50]
The loan balance is the line that moved most. Loans receivable from non-controlling shareholders stood at $18,769 thousand at December 31, 2025 against $2,106 thousand a year earlier, a roughly nine-fold increase, described as amounts assumed in acquisitions and amounts issued to non-controlling interests to finance sales of subsidiary stakes to senior managers [51]. In the same year the company paid $78,156 thousand to buy interests back from redeemable non-controlling interests and sold $30,674 thousand of interests to them, while the mezzanine balance rose to $1,285,046 thousand [52]. The Ayesa acquisition completed on May 27, 2026 on the same template, with the acquired leadership retaining significant equity [53].
Docket
The statements disclose no material proceeding against the company or its officers. Litigation pending or threatened is described as routine claims incidental to the business, including disputes with former employees and commercial liability claims related to services provided, with resolution not expected to have a material impact [54]. Separately, the lending business shares up to one-third of losses on Fannie Mae DUS loans with an aggregate unpaid principal balance of approximately $7,196,000 thousand at December 31, 2025, against a loss reserve of $12,655 thousand [55].
The circular's cease-trade, bankruptcy, penalties and sanctions disclosure reports one item across all ten nominees, and it is a corporate insolvency rather than a finding against any individual: Benjamin Stein served as a director of GTT Communications, Inc. from May 2019 until December 2021; GTT commenced Chapter 11 proceedings in the United States in October 2021, completed in December 2022. No order, penalty or sanction is disclosed against any director or officer.
Shareholder votes on these arrangements
Support at the April 1, 2025 meeting, as reported in the 2026 circular, fell on the compensation questions and on three directors. The advisory resolution on executive compensation passed with 61.43% support, against 92.17% the year before. Ms. Lee, who chairs the Compensation Committee, was elected with 73.29% against 95.33% a year earlier; Ms. Gavan with 78.00% against 92.63%; Mr. Stein with 80.48% against 96.94%. The three Compensation Committee members drew the three lowest votes on the board. The 2024 amendment to the stock option plan passed with 73.25%. Results of the March 31, 2026 meeting, which included a further option plan amendment and a say-on-pay resolution, are not in any source read for this page.
What the record does not settle
Three questions sit open on the evidence assembled here, and this page does not attempt to answer them.
The chief executive incentive is measured on absolute market capitalization, which rises when shares are issued for acquisitions, rather than on value per share. Whether the three unvested tiers can be reached on the current share count, or require issuance, is a matter for the capital-allocation record in History.
The chief financial officer now also runs the largest operating segment, and the chief investment officer moved to engineering, with no disclosed successor slate. What that means for the finance function and for segment reporting is a question for Business.
Loans to non-controlling shareholders rose from $2.1 million to $18.8 million in a year while $78.2 million was paid to buy minority interests back, and approximately 7,300,000 shares would be issued if all outstanding puts and calls settled in stock. The partnership model that produces those balances is described qualitatively; its cash and share cost over time is not.
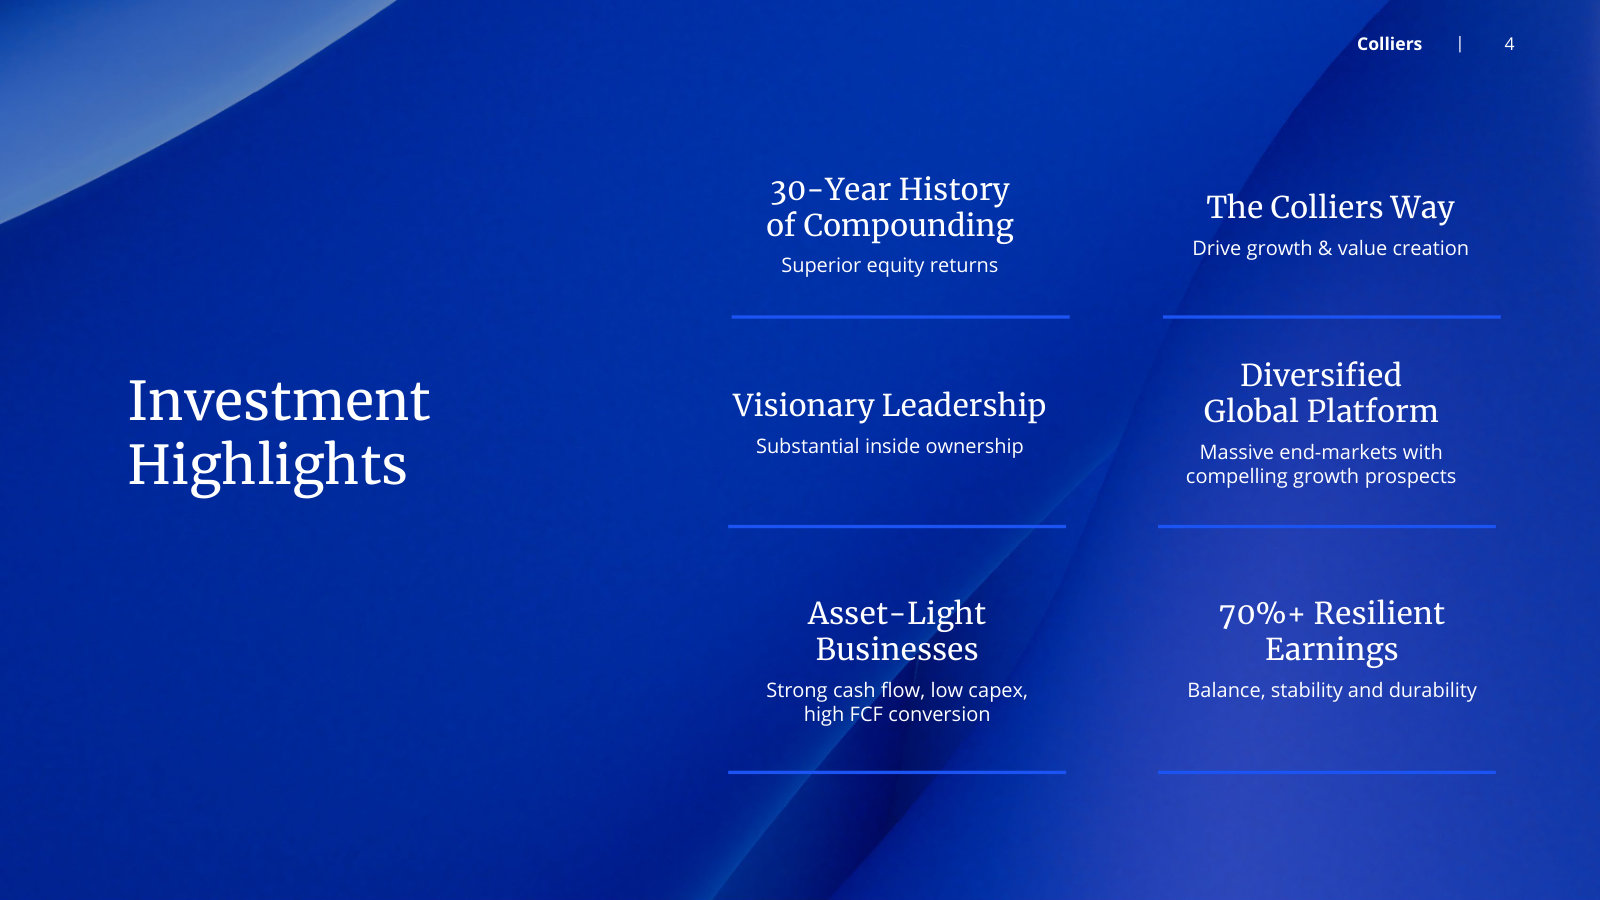
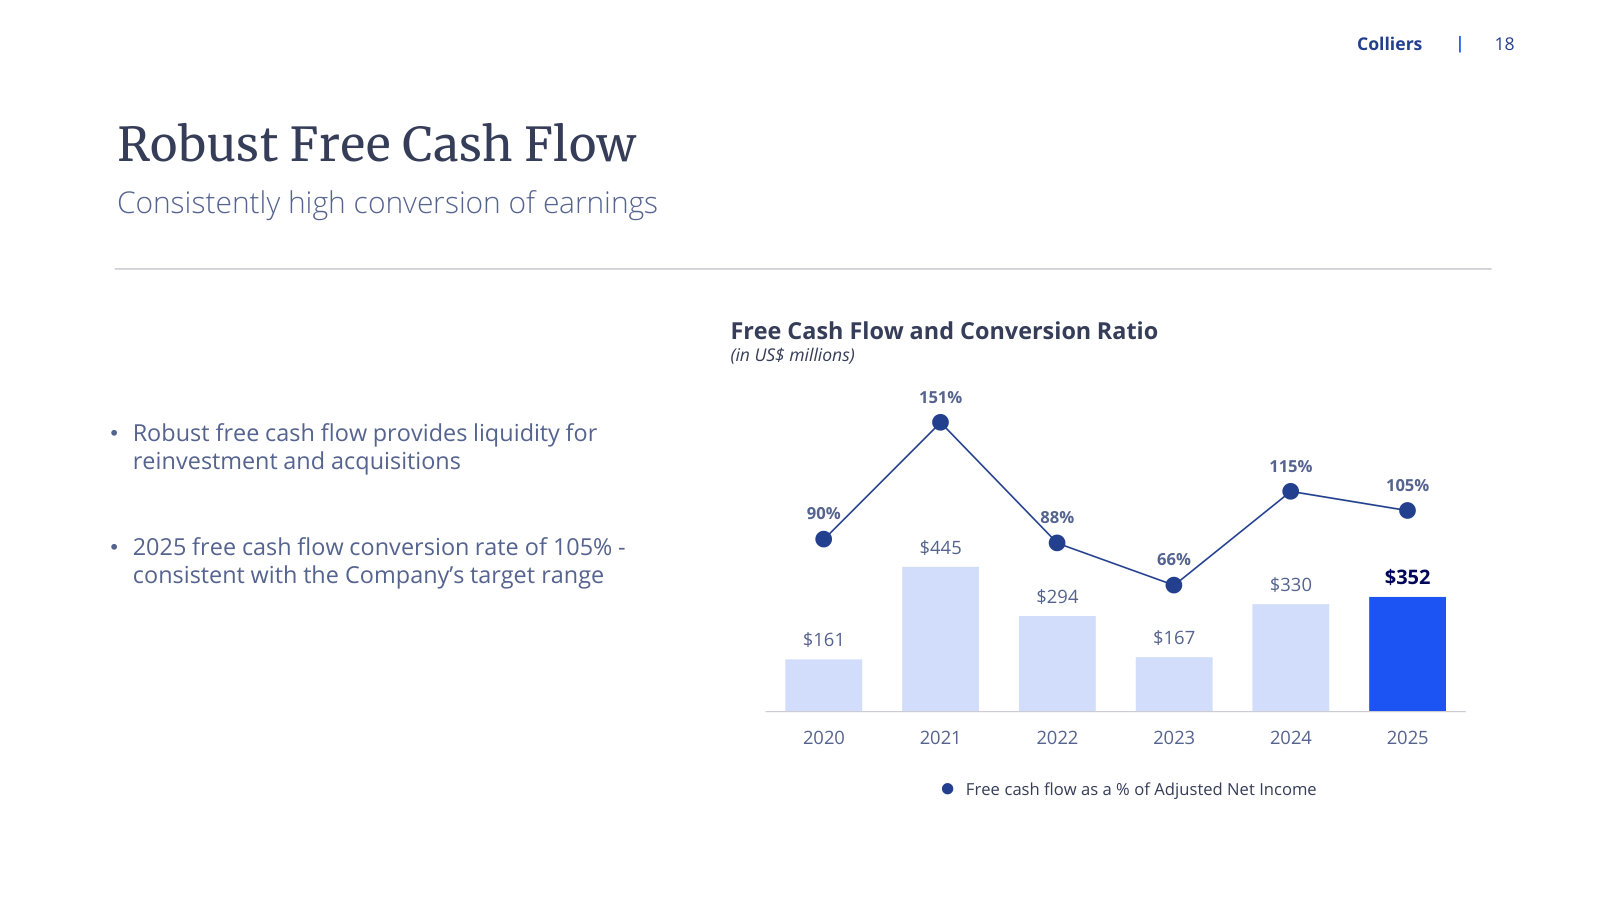
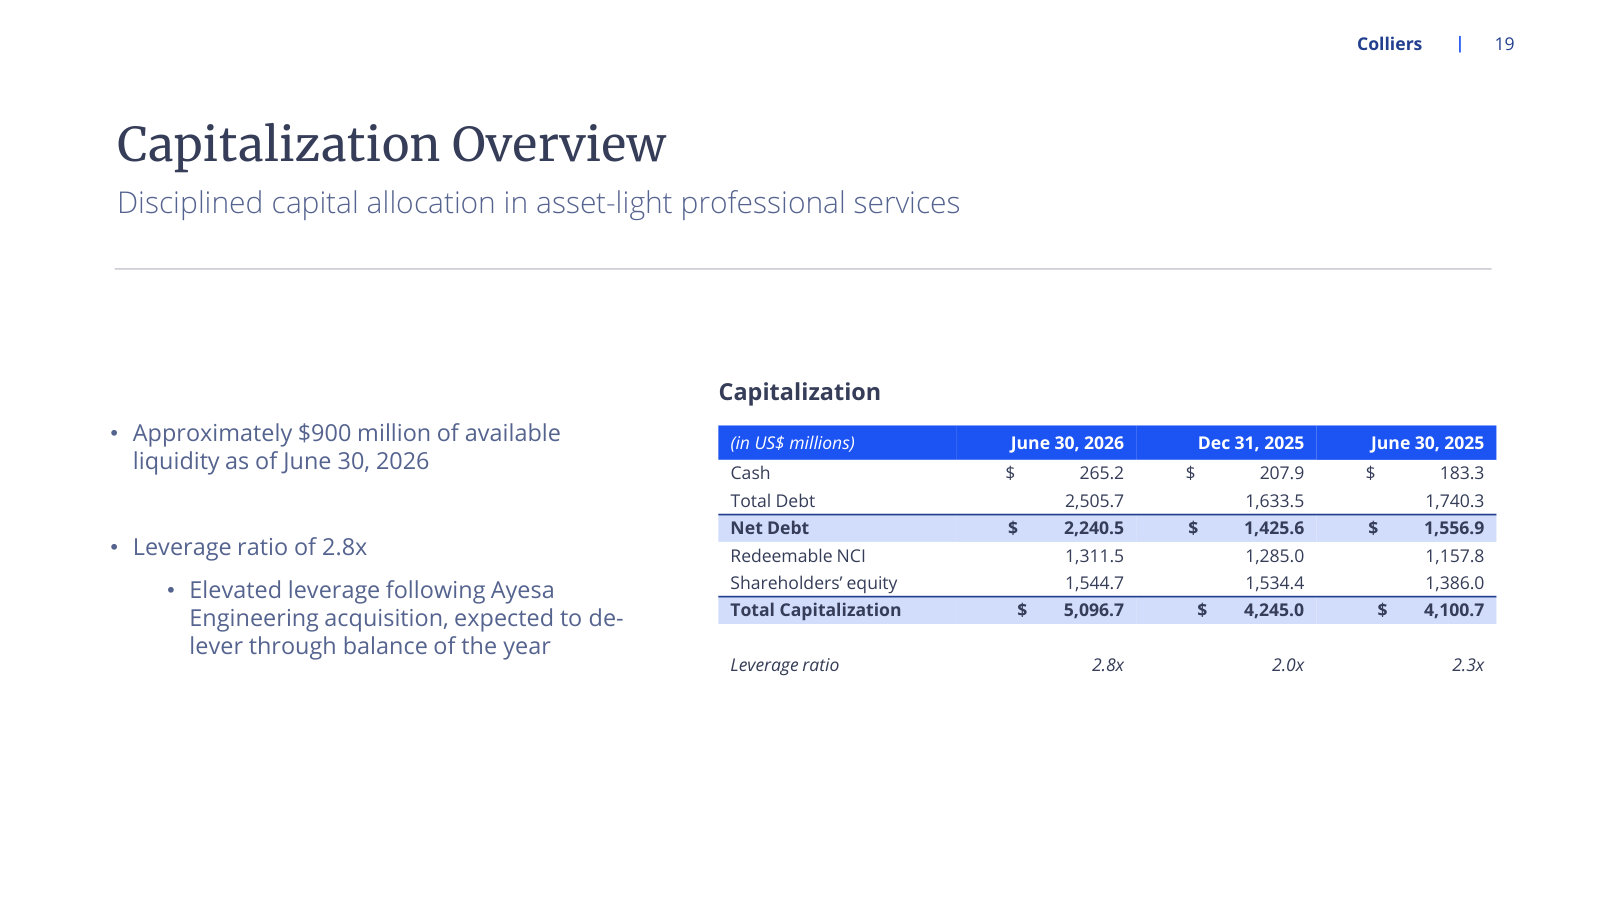
Colliers International Group Inc.'s management explains the business in its own materials. The slides below do the most of that work, pulled from the documents preserved in Sources. Each source link opens the complete presentation at that slide in a new tab.
Investor Presentation — August 2026
Management's fullest current explanation of the company: segments, unit economics, strategy and the six-year financial record. · Open the full document →
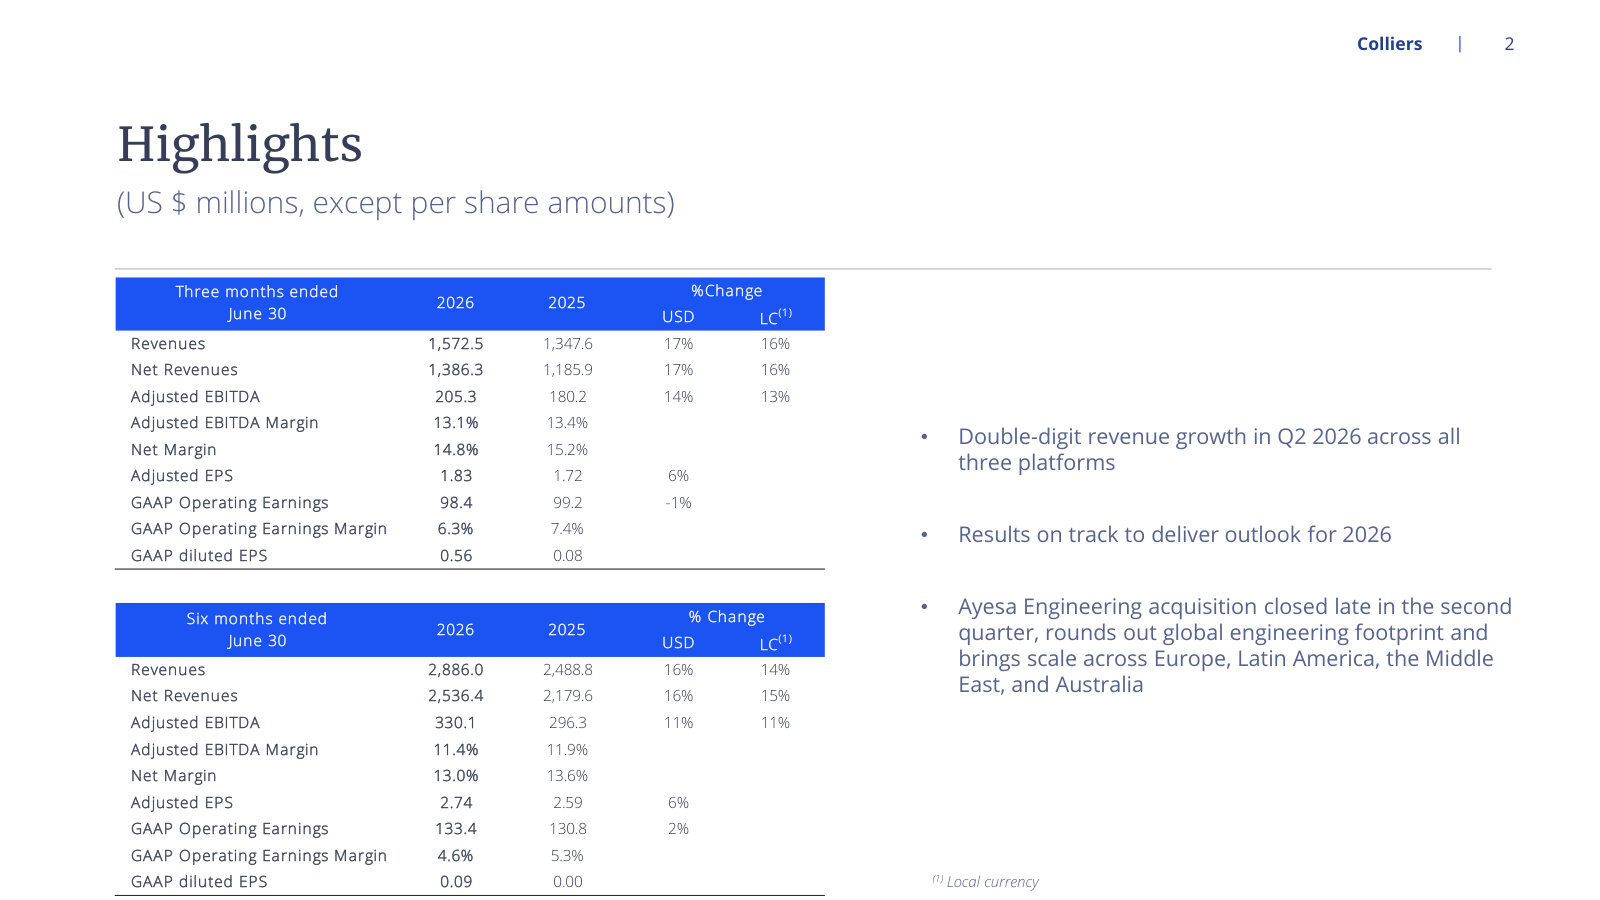
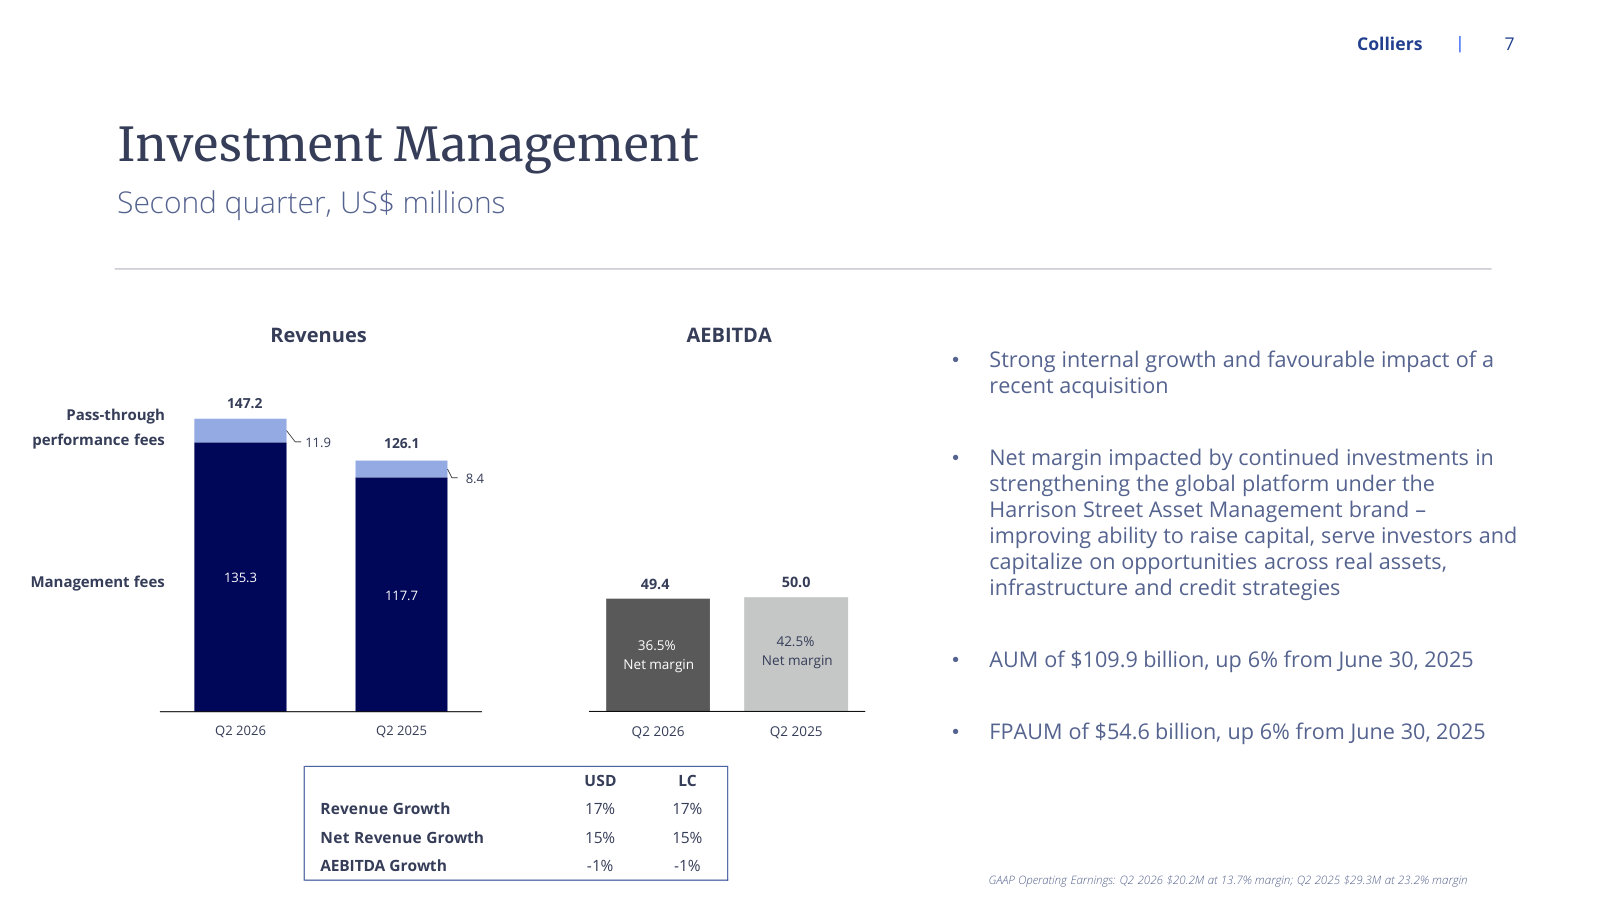
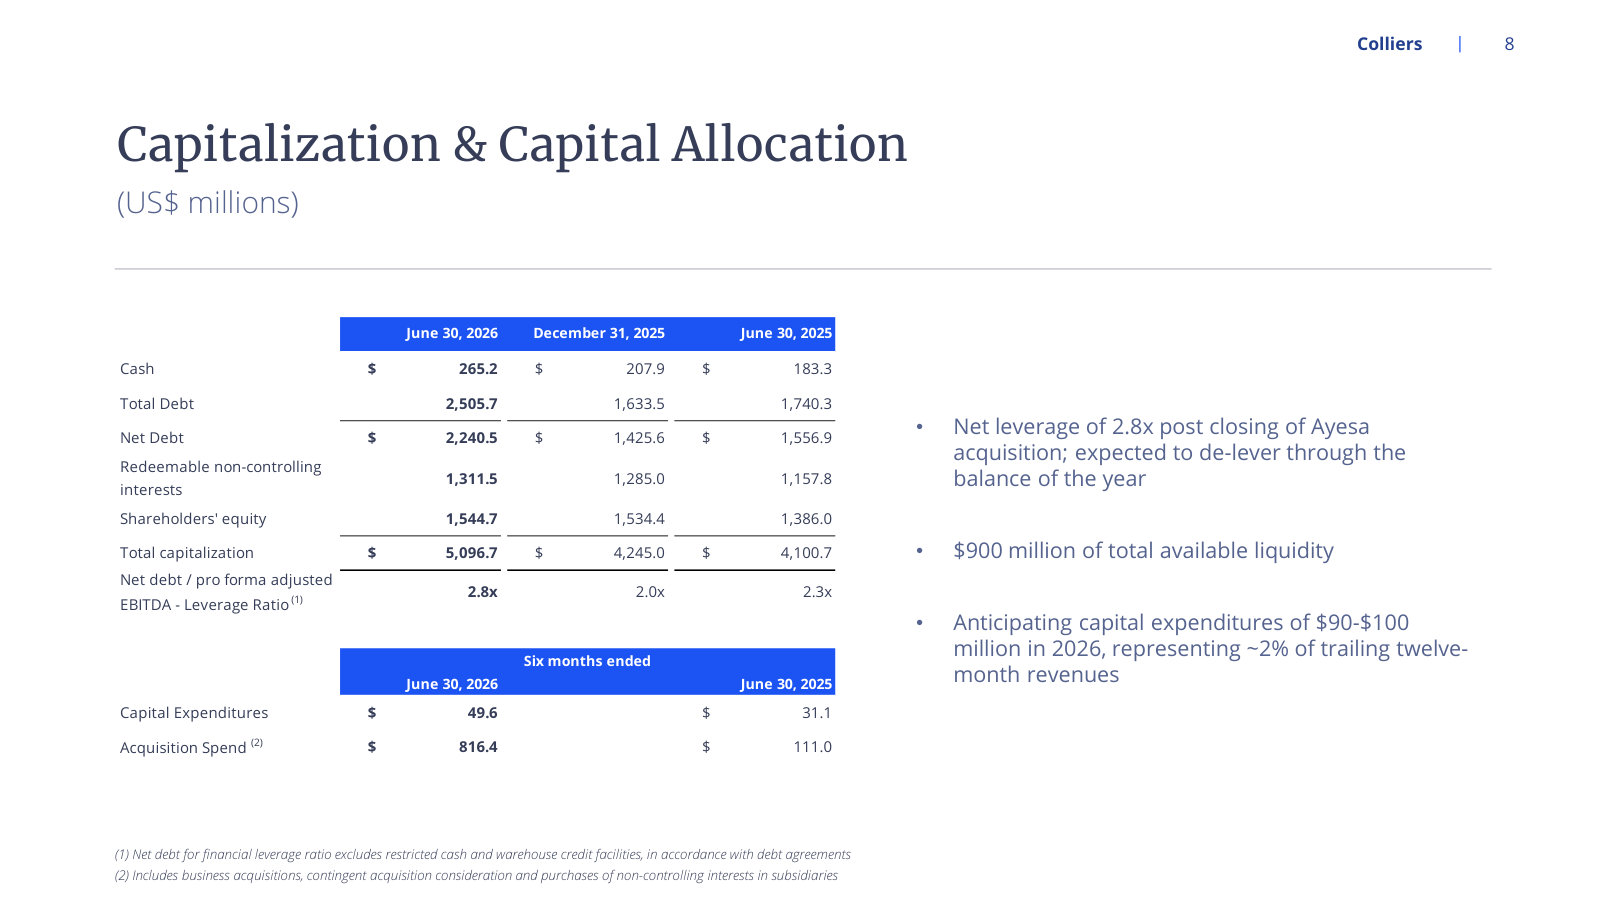
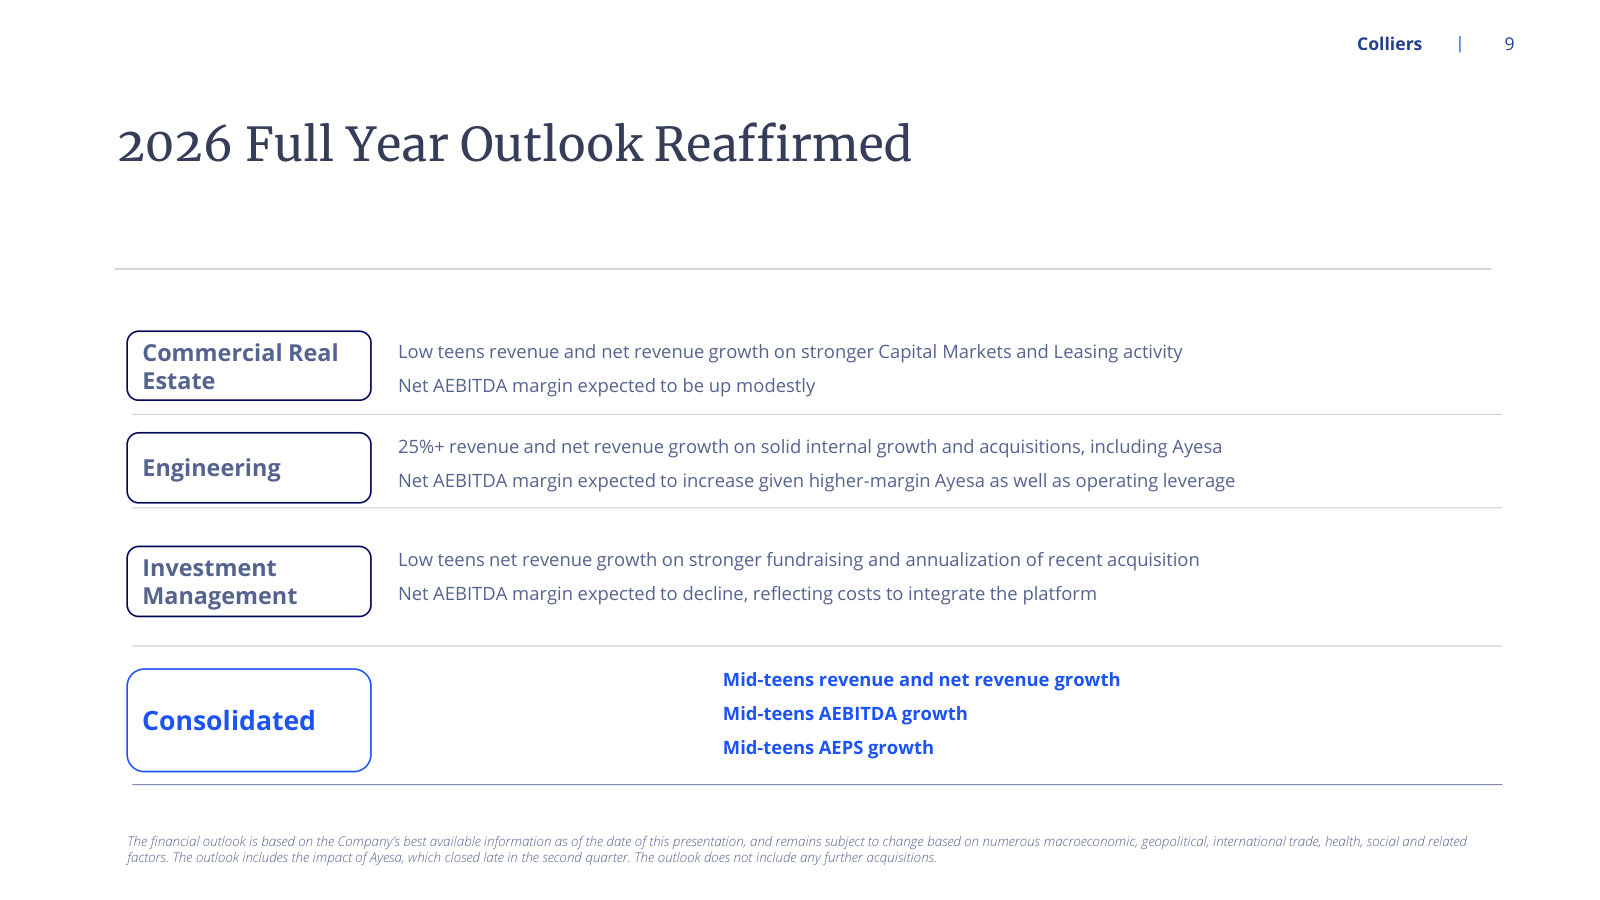
Second Quarter 2026 Results — Q2 2026
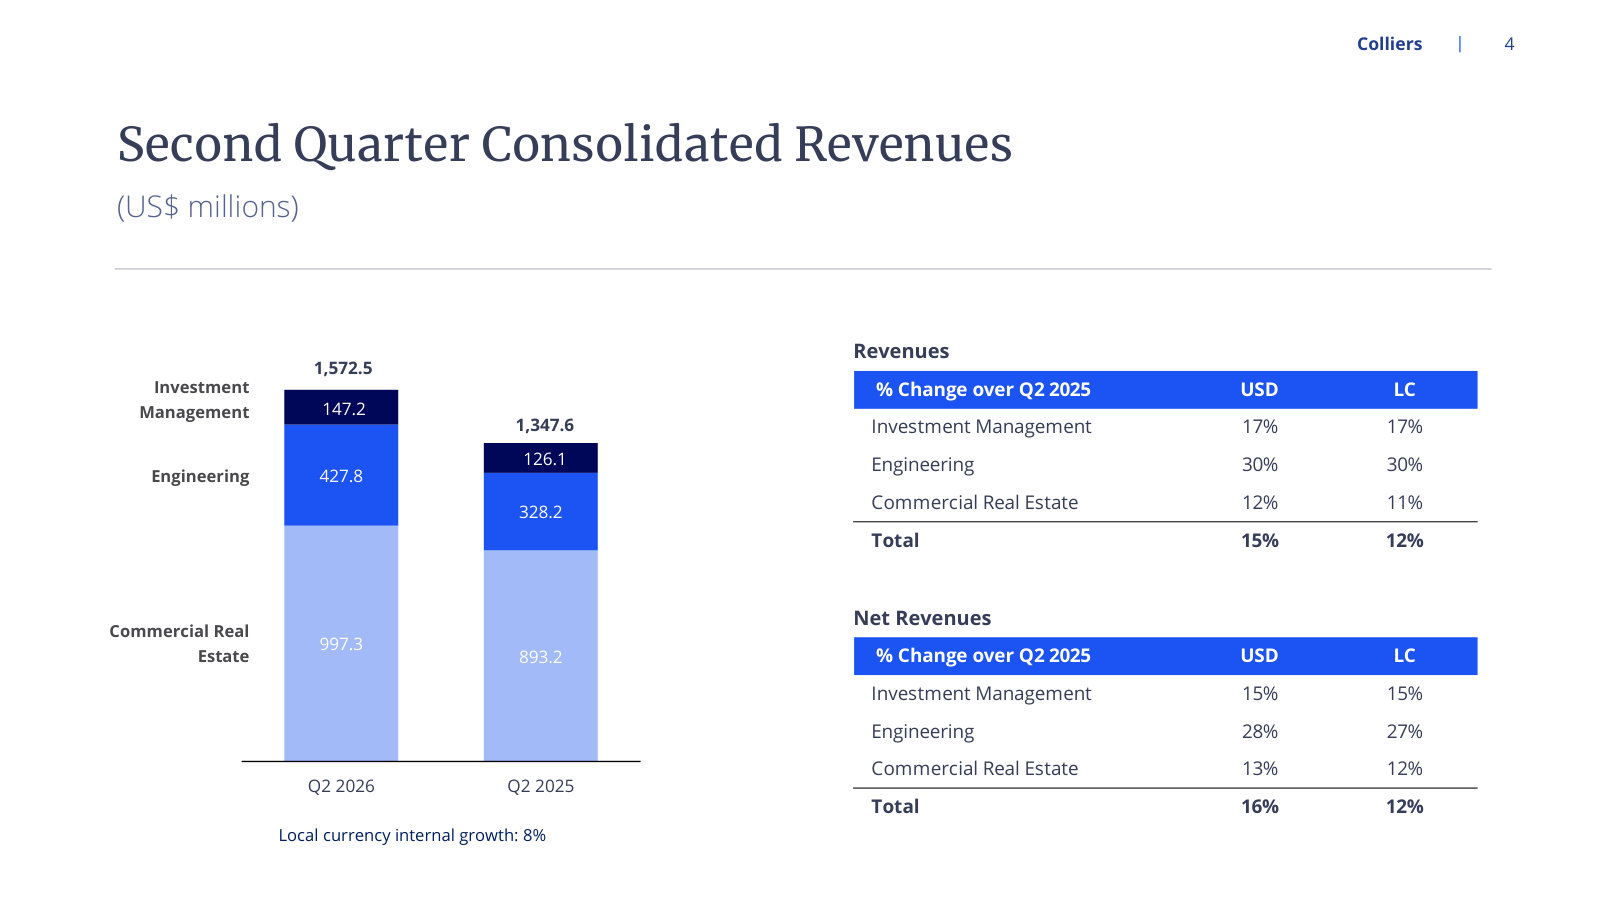
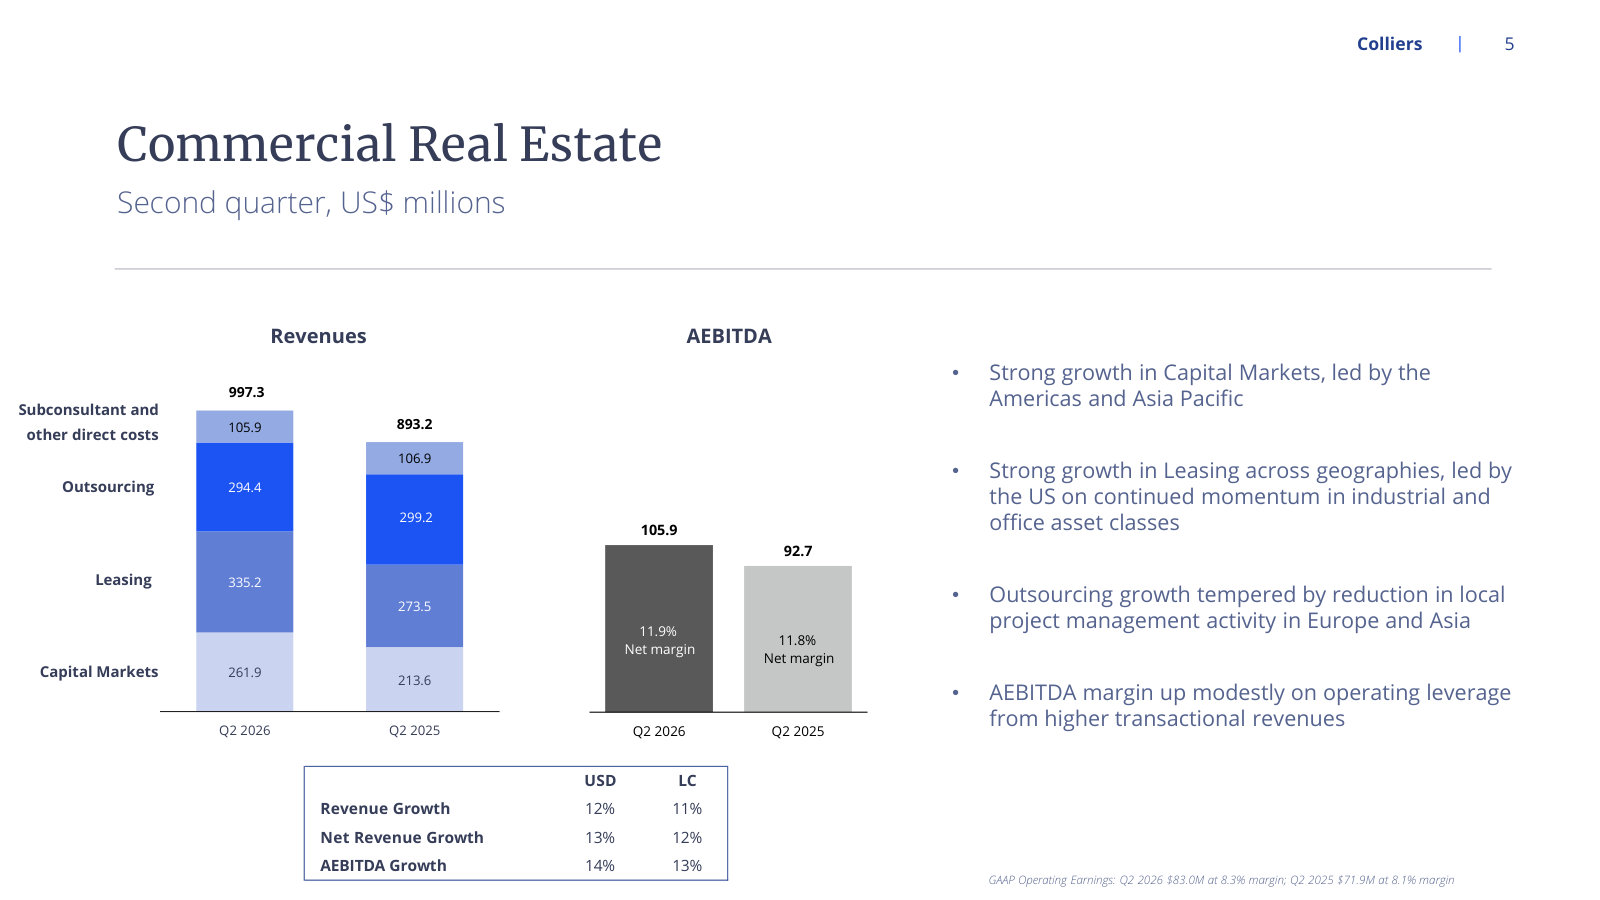
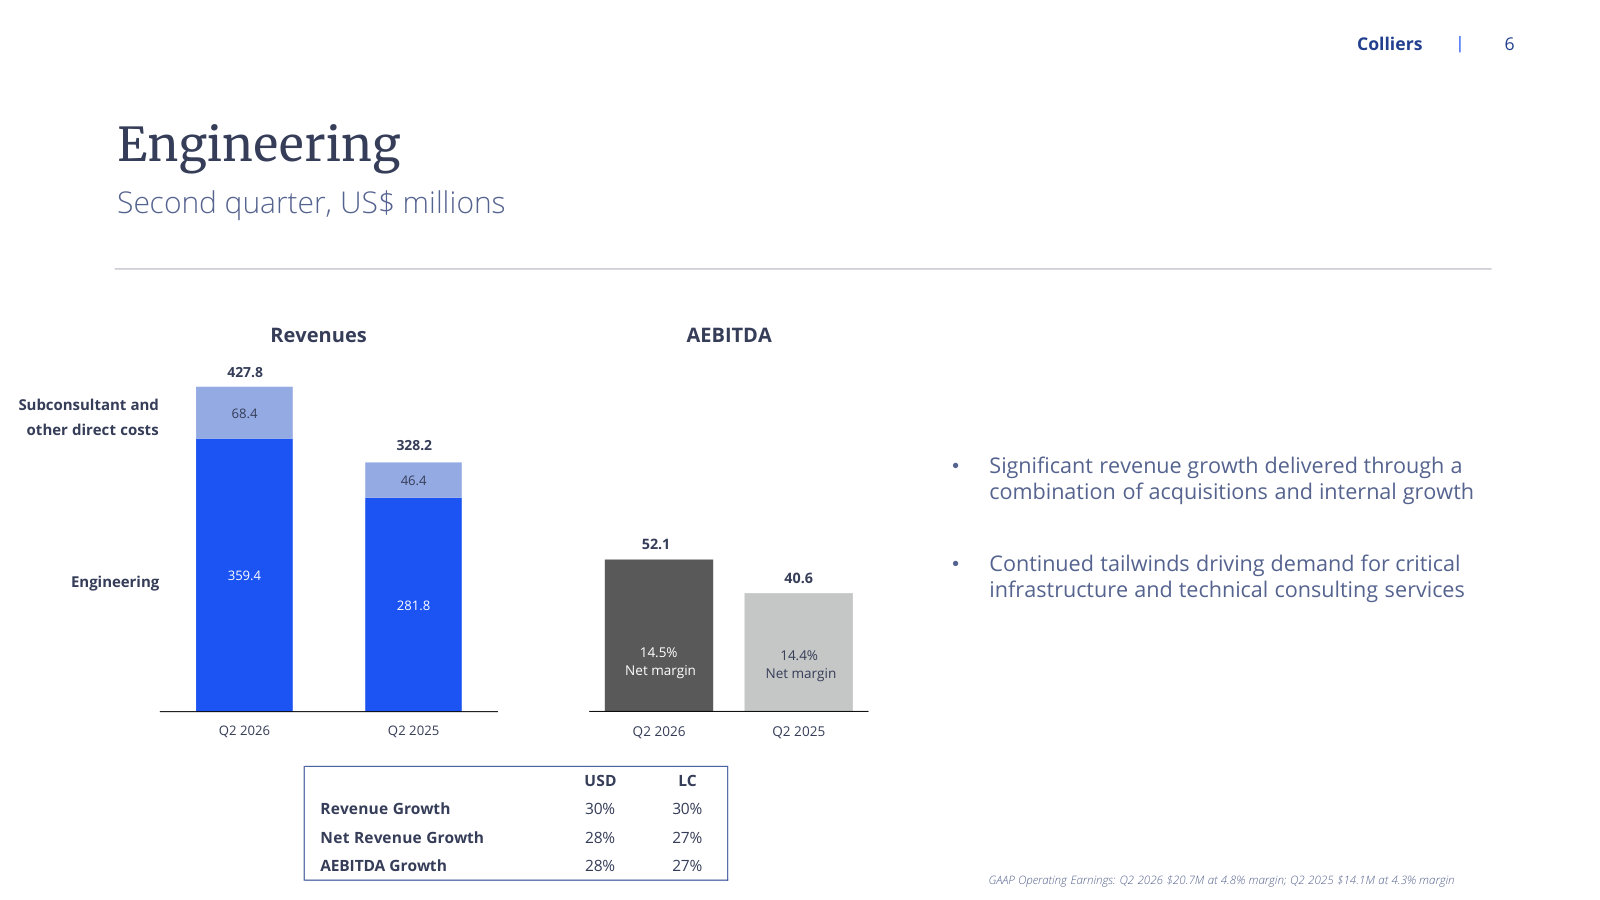
The latest quarterly deck: current run-rate by segment, the post-Ayesa balance sheet, and 2026 guidance reaffirmed. · Open the full document →
Fourth Quarter 2025 Results — Q4 2025
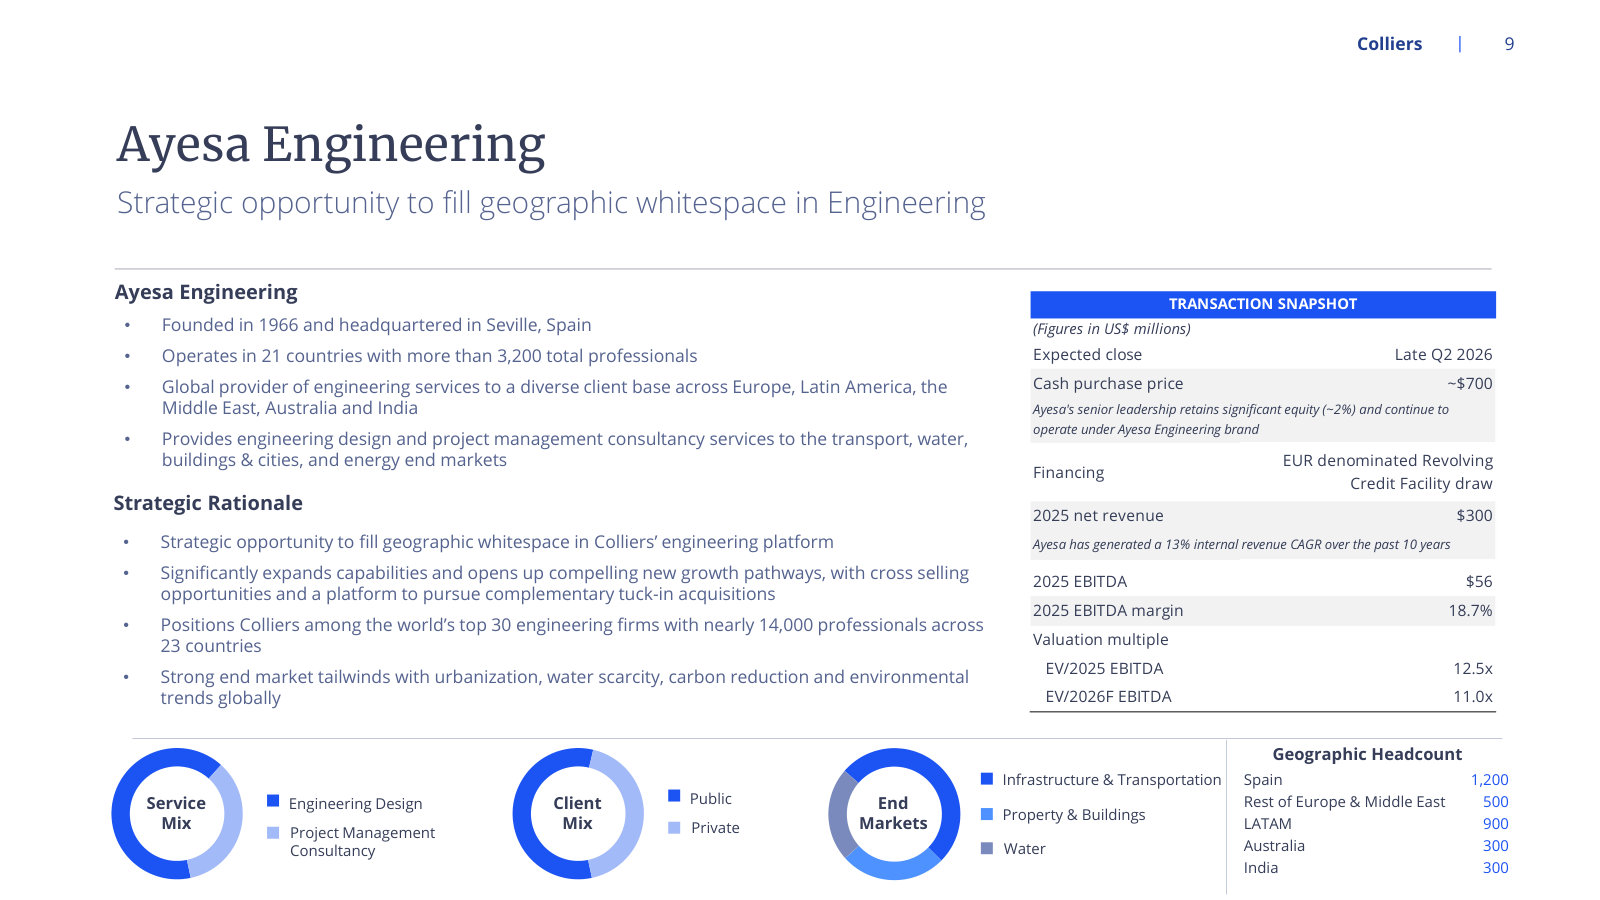
The FY2025 wrap: full-year segment economics, plus the Ayesa acquisition that reshapes the Engineering segment. · Open the full document →
More from management
First Quarter 2026 Results — Q1 2026 · 15 pages · The first print against 2026 guidance, and the last quarter before Ayesa closed. · Open →
Fourth Quarter 2024 Financial Results — Q4 2024 · 20 pages · FY2024 full-year segment results and the original 2025 outlook — the base year for today's growth rates. · Open →
Fourth Quarter 2023 Financial Results — Q4 2023 · 25 pages · The cycle trough: FY2023, when Capital Markets stalled and Engineering had not yet been scaled up. · Open →
Colliers International Group Inc.'s management answers for the business every quarter. These are the exchanges that explain it best — verbatim, from the call transcripts preserved in Sources. Each link opens the full transcript at that page in a new tab.
Q2 2026 Earnings Call — Q2 2026
The current thesis in management's own words: three platforms, 70% recurring earnings, and a buyback finally on the table. · Open the full transcript →
Management's own framing of the three-platform model and how it is meant to compound.
Jay Hennick (Global Chairman and CEO, Colliers): Having built two large global platforms at Colliers in Commercial Real Estate and in Engineering, we are now building our third. We are bringing our investment management capabilities together across real estate, credit, infrastructure, and private wealth. We are creating more investment opportunities for our clients and greater long-term value for our shareholders. […] Today, approximately 70% of our earnings come from resilient, recurring revenue streams, giving Colliers greater flexibility, greater stability, stronger cash flow, and perhaps most importantly, more ways to grow our business. What further differentiates Colliers is how our platforms are working together. Commercial real estate gives us market intelligence and deep client relationships. Engineering adds technical expertise and execution capability. Harrison Street brings capital formation, investment discipline, and ownership expertise. Together, they create a much more integrated Colliers, one that can engage clients earlier, serve more of the value chain, and replicate that model across high-growth ecosystems. Data centers is just one example. We can help clients identify and acquire sites, provide engineering, and technical services to design, build, and operate these facilities, and deploy capital through Harrison Street, which over the past six years has invested more than $6 billion in digital infrastructure and data centers already.
p. 5 · Read in context →
Why a fundraising headline does not become fee revenue on a fixed schedule.
Himanshu Gupta (Scotiabank); Christian Mayer (CFO and CEO of Commercial Real Estate, Colliers): Okay, thank you. Maybe just last question. I think over $2 billion was raised during the quarter. Has this capital been deployed? I'm just trying to see that when will this raise will lead to EBITDA pickup in numbers? […] Yeah. We did raise $2.2 billion of new capital in the second quarter. That capital comes in a mix of fund types. Some of the closed-end funds, that capital becomes fee-bearing immediately. In other fund types it will take some time to deploy that capital and then that capital will at that point become fee-bearing. This is a normal part of the fundraising process. Some capital, as I mentioned, becomes fee-bearing immediately. Some takes time to be deployed and then become fee-bearing. That's reflected in our expectations for the year.
p. 7 · Read in context →
Share gains are real; the CFO also concedes the producer hiring behind them is a drag on margin.
Erin Kyle (CIBC Capital Markets); Christian Mayer (CFO and CEO of Commercial Real Estate, Colliers): Growth has been quite strong for the past two quarters in Capital Markets and leasing this quarter as well. That's in despite of an interest rate environment that hasn't necessarily been as constructive as everyone was expecting, maybe heading into the year. Would you say that's mainly a function of pent-up demand in the market, or is Colliers winning share here? As I know you've been recruiting for new team members across the CRE segment as well. […] Erin, we certainly believe all that is the case. We have been winning share of market. In particular, in terms of our recruiting efforts, I think we've been very disciplined but yet aggressive on recruiting. We've added more producers than others. I think relative to our publicly traded peers, in the U.S. at least, we've added more producers on a percentage basis than they have. It has been a modest drag on our margins over the last few quarters as we ramp these folks up. We're feeling very good about our business and about the trajectory. The rate environment, of course, is one that is top of mind for real estate investors. I think as long as it's in a range, activity levels will continue.
p. 10 · Read in context →
Asked how AI risk gets priced into engineering acquisitions, the CEO says purchase multiples are being marked down.
Jimmy Shan (RBC Capital Markets); Jay Hennick (Global Chairman and CEO, Colliers): Maybe just as a follow-up, you've still been acquiring, obviously, the last few acquisitions have been on the engineering side. I guess with the uncertainty with respect to how AI can potentially impact the business, at least from a public market perspective, I wondered if there's been any change in the multiples that you've observed that people are paying for engineering firms, or how would you underwrite, if at all, any AI risk when you underwrite those businesses? […] Technology and AI, they're always an important element. Everybody woke up last week, and all of a sudden, AI is a fancy word. For years, we've been using technology to automate workflows, and get productivity gains, and take our specialized data, and create special insights and unique insights for our clients. One of the things that we've done in light of the additional focus on AI is we tasked our people to create a shopping list of ideas and opportunities that can improve our business further using AI. There were several interesting ones, and we've increased our technology spend against the highest priority initiatives. AI has actually become a benefit in the sense that it's raised the focus around making changes to our business to become more competitive and unlock some embedded data sets that we might have. […] Really, at the end of the day, it's not about all of that. It's about professional judgment, specialized expertise, and trusted relationships which don't change. When I think about both commercial real estate and I think about engineering, I think that they are going to only get better, more efficient, but the most important thing which you alluded to in your first sentence is, yes, we are adjusting down the purchase prices, arguing that AI is going to have a major impact on some of these businesses, which it will not. I say will not. It will not to the big players because we're in the game and we're doing what we need to do. The small guys don't have the depth and capital to capitalize on these things. The bigger guys do, and I think AI will only help us make our business better. […] The smaller guys don't have those advantages, and as a result, we could be buying, and are buying exceptional businesses, albeit smaller, at better valuations this year than last year, for example, for that reason.
p. 11 · Read in context →
The CFO caps leverage at 2.8x and sizes the buyback: about $100 million, 1%-2% of the float.
Daryl Young (Stifel); Christian Mayer (CFO and CEO of Commercial Real Estate, Colliers); Jay Hennick (Global Chairman and CEO, Colliers): Got it. Just one last one. On the NCIB, did you say you'd be willing to take the leverage back to three times in the back half of the year to get aggressive on the NCIB, or did I mishear that? […] Daryl, to be very clear, we did not say that. In my view, 2.8x is the high water mark. We're going to de-lever through the balance of the year. We may, at these prevailing prices, spend, call it, say, just for argument's discussion's sake here, $100 million would buy back 2%, 1% of our float. It could be nicely accretive without being meaningfully impactful on our leverage. Certainly we don't expect to have a material increase to our leverage as a result of a stock buyback action. […] It really depends on the M&A opportunities as well, because we do have quite a pipeline of deals, we'll have to see how the balance of the year shakes out before we execute on that.
p. 13 · Read in context →
The long-term leverage target, and the acquisition carve-out that has kept actual leverage well above it.
Mitch Germain (Citizens Bank); Christian Mayer (CFO and CEO of Commercial Real Estate, Colliers): Then, remind me what you guys are viewing as more of a long-term leverage target. I think you were back in 2024, you were around two times. It's come up with a bunch of acquisitions. I know that you're forecasting it to come down a bit by year-end. Longer term, is there some sort of range that you consider to be what you're striving to target? […] Yes, Mitch. Our target leverage range is one and a half to two times with a bump out for significant acquisition activity, which I guess certainly falls in that category.
p. 15 · Read in context →
What the guidance rests on: transaction pipelines, the 10-year Treasury, and a 12-month engineering backlog.
Stephen MacLeod (BMO Capital Markets); Christian Mayer (CFO and CEO of Commercial Real Estate, Colliers): you talked in your prepared remarks about having very strong back half visibility into all three segments, and I'm just curious what the foundation of that is. Maybe starting with CRE, what are your customers saying about the rates environment? In engineering, you talked about having a 12-month backlog, and I'm just curious how that's trended relative to prior quarters. […] We track our pipelines in Commercial Real Estate in a very disciplined manner. We've been doing this for a long time, and it's something that is a key part of what we do every day and how we manage the business every day. We certainly look at the 10-year Treasury as a bellwether for the U.S. particular. At 4.7%, it's kind of on the high end, but it moves around, as you know. With the information we have and in our best judgment, we see a strong list of transactions that will happen over the next year. We have more visibility into the more near-term transactions, being the ones in the next quarter or the next six months. As a result, that gives us the confidence we're looking for. […] In terms of our backlogs in engineering, we have really four engineering businesses that operate around the world, Ayesa being the newest. Each one has a wide variety of clients and end markets, and each one tracks its revenue backlogs. Our goal always is to have a 12-month backlog of work under contract. That is where we currently sit. I know that can vary a little bit seasonally. Certainly right now where we sit is very comfortable and we have the visibility we need from that backlog to give you the outlook that we delivered.
p. 17 · Read in context →
Q4 and Full Year 2025 Earnings Call — Q4 2025
The annual call: full-year scorecard, segment-by-segment 2026 guidance, the Ayesa rationale, and the AI question answered at length. · Open the full transcript →
The scorecard management holds itself to, and the acquisition that reshapes the engineering platform.
Jay Hennick (Global Chairman and CEO, Colliers International Group): 2025 is an exceptional year for Colliers. Repeat, an exceptional year for Colliers, reflecting the strength of our diversified platform and our successful expansion into other high-quality, recurring professional services. Today, more than 70% of our earnings come from these resilient businesses, approaching 75% once recent acquisitions are included. Our fourth quarter results were in line with expectation and were up nicely over last year, which itself was a very strong year-over-year performance. Last week, we achieved another milestone, agreeing to acquire Ayesa Engineering, a world-class business and a rare opportunity at this scale. […] This acquisition meaningfully expands our avenues for growth, strengthens our ability to scale organically, pursue further acquisitions, and cross-sell engineering capabilities across our global client base. Once closed, Colliers Engineering will rank among the top 30 global engineering firms with expanded presence in Europe, Latin America, and the Middle East. […] Over the past five years, despite challenging and often unpredictable conditions, Colliers doubled its size, delivering compound annual growth rates of more than 15%, and based on what we see today, we expect similar performance again in 2026.
p. 5 · Read in context →
Segment-by-segment 2026 guidance, with the caveat that Capital Markets stays well below prior peaks.
Christian Mayer (CFO, Colliers International Group): In that spirit, we are introducing our outlook for 2026 as follows: In commercial real estate, we are expecting low teens top-line growth and a modest increase in net margin, predicated on a continued recovery in Capital Markets. It's important to note that even with this growth, our Capital Markets activity will remain well below prior peaks[…]. Our Engineering segment is expecting mid-single-digit internal growth and the impact of acquisitions, including Ayesa, resulting in total top-line growth of over 25%. This growth is supported by a strong backlog and favorable trends in infrastructure, urbanization, and energy transition, along with increasing data center demand. Investment Management, net revenue growth is expected to be in the low teens, with growth led by higher management fees as fundraising continues to accelerate. Putting it all together, we're expecting mid-teens growth in all three of our key operating metrics.
p. 6 · Read in context →
The clearest account of engineering economics: roughly 60% is design work, not billed hourly, at higher margin.
Tony Paolone (JPMorgan); Jay Hennick (Global Chairman and CEO, Colliers International Group): I'd like to start with engineering and just a bit on the organic growth there. You know, as you roll that up, if I think about that business, I think about it being like an hourly rate, number of professionals, and the number of hours worked. Can you talk about just, like, what's happening with some of those trends organically and, you know, where you're finding success or not and sort of those revenue synergies as you roll this up? […] Let me let me add, Tony, a couple of things that just maybe simplify some thoughts. Probably 60% of the engineering business is what I would categorize as design, which is design of all types of solutions, which is not hourly based, although we do, we do manage our labor on an hourly-based basis, but it is not priced to clients on the basis of an hourly rate. The balance of the business is more, I would say, closer akin to project management. Once the design is complete and needs to be executed upon, it's closer to an hourly rate kind of structure. So, we love that business because the design aspect allows us to generate higher margins, yet the the hourly rate portion or the, or the project management portion is something that is certain. […] It is long term. For example, we have some clients where the execution of the project may be 10 or 12 years, where we're allocating X number of people for a long period of time to oversee the completion of the work. So it's a very interesting business opportunity for us. It's a very good business, and as Christian said, there's a shortage of engineers virtually everywhere in the world, which is driving up pricing. You know, we'd like it to drive it up a little bit more, but it is driving up overall pricing because it's hard to get qualified engineers. So I thought I'd add that little editorial.
p. 7 · Read in context →
February 2026: buybacks ruled out while the deal pipeline is live — a stance reversed by the July call.
Daryl Young (Stifel); Jay Hennick (Global Chairman and CEO, Colliers International Group): I wanted to start with a question just on capital allocation and, specifically where the share price is today and, and your thoughts on buybacks or, or an SIB. […] I'd love to buy back stock right now. But we have lots in the pipe, including Ayesa, as you know. And we believe more behind that. So we're watching our capital carefully. It's very easy to do an equity offering and dilute shareholders, but that's never been our MO. We're in the business of creating long-term shareholder value. So you know, buying back stock is not really in the, as a corporate matter, is not really in the plan. But on a personal level, it might be in the plan.
p. 8 · Read in context →
The 2026 Capital Markets guide assumes no rate cuts, only that a backlog of deals must eventually transact.
Erin Kyle (CIBC); Christian Mayer (CFO, Colliers International Group): I wanted to start maybe on the macro here, and if you can just give us some more detail on what you're seeing from a macro perspective as it relates to the Capital Markets pipeline here, and then maybe just elaborate a little bit on what's baked into that 2026 guide and whether it depends on some additional rate cuts here. […] Yeah, Erin, we're not counting on rate cuts in terms of our outlook for Capital Markets. Capital Markets is benefiting from a pent-up supply or pent-up demand, a pent-up supply of transactions. As you know, transaction activity has been slow for a number of years, and there's a lot of people in the market that want and need to transact, and that's starting to turn into revenues for Colliers. So that's really what we're seeing. We had strength in 2025 in Capital Markets, and we expect that to continue in 2026, with more transactions happening at all price points across all markets. 2025 was led by the U.S. […] I think the U.S. will continue to be very strong, and hopefully, volumes will pick up in EMEA and Asia Pac, which have been a little bit slower.
p. 9 · Read in context →
The investment-management margin path: down to the high 30s in 2026, back to the mid-40s in 2027.
Stephen MacLeod (BMO Capital Markets); Christian Mayer (CFO, Colliers International Group): just on, on the investment management business, just as you, as you work through the investments you're making this year and coming out the other end, you know, better, better positioned to, capital formation and things like that. Christian, could you just talk a little bit about sort of where you see margins going once, once the, once the, the investment on, in unified into the unified platform has been, has been made? […] Yeah. You're gonna see margins decline in 2026 to the, you know, high 30s net margin area. And then in 2027, we're expecting to return to our historical average margin in the mid-40s. So that's, you know, essentially, you know, with fundraising, as we outlined, you know, starting to accelerate, and with these integration efforts behind us.
p. 11 · Read in context →
Q2 2025 Earnings Call — Q2 2025
The tariff quarter: leasing fell while engineering grew 70%, and the diversification claim was tested in public. · Open the full transcript →
The diversification claim under load: industrial leasing hit by tariff uncertainty, engineering net revenue up 70%.
Christian Mayer (CFO, Colliers International): Leasing revenues declined 5% globally, coming in below expectations. While office leasing was strong, it was offset by weaker industrial volumes due to tariff-related and other macroeconomic uncertainty. Segment net margin was down slightly to 11.9%, impacted by revenue mix and continued investments in recruiting. […] Our engineering net revenue jumped 70%, fueled by acquisitions and internal growth of 8%. The net margin rose to 13.7%, a substantial increase from last year, with improvements coming from both acquisitions and enhanced productivity in our core operations. We continue to monitor any potential impacts from tariffs or government policy, but we've seen no significant effect on our backlogs to date.
p. 6 · Read in context →
Cash conversion and why it holds: a working-capital-light model with modest capex.
Christian Mayer (CFO, Colliers International): On a trailing 12-month basis, we converted 98% of adjusted net earnings into free cash flow, in line with our long-term target. As we've noted before, our working capital-light business model and modest CapEx result in strong free cash flows available for reinvestment and growth. […] Turning to our balance sheet, our leverage ratio was 2.3x as of June 30th. Second quarter leverage was slightly higher than anticipated, firstly due to our increased pace of acquisitions and secondly due to the recent appreciation of the U.S. dollar, which increased the reported value of our foreign denominated debt. With the completion of the Asterisk and RoundShield acquisitions in July, we now expect our leverage to decline to just under 2x by year-end. This assumes no additional major acquisitions.
p. 6 · Read in context →
Where tariffs actually bite: the markets Colliers is strongest in are among the most exposed.
Anthony Paolone (JPMorgan); Jay Hennick (Global Chairman and CEO, Colliers International): My first question relates to Leasing. I understand the industrial weakness that occurred in the quarter. Just wondering, did you find that to be a surprise? Did the market change more dramatically than maybe you thought? Also, what's it look like today? Has there been much of a rebound as you start to look at the second half of the year? […] Tony, we'd expected leasing softness for the second quarter. I think we telegraphed that in our first quarter commentary. We compete in many markets. We have a very diversified business in 35 countries and strong positions in places like Canada, Australia, and Western Europe that are heavily tariff-impacted. That was something we thought would weigh on our results, and it did. Although I can report that July has been more positive in terms of trajectory on that, and that includes industrial leasing activity being trending more positively today.
p. 7 · Read in context →
Pressed on an investment-management spin-off and the sum-of-the-parts gap, the CEO neither commits nor closes the door.
Stephen Sheldon (William Blair); Jay Hennick (Global Chairman and CEO, Colliers International): I also wanted to ask about the IM branding consolidation under Harrison Street. Jay, you've been pretty vocal, I think, about investors undervaluing the IM segment and the team considering a potential spin-off. Does the rebranding set the stage even more for that? Generally, how serious are you about pursuing that if Colliers doesn't get the sum of the parts valuation you think it deserves? […] We always look at our overall valuation, and we believe that the overall valuation, especially given the component parts of Colliers, is materially below where it should be. The steps we're taking in the IM segment are probably steps we would have taken anyway. For those that follow us, you'll know that our reluctance so far to accelerate doing anything, and we haven't made any final decisions about this, has been really around fundraising. The fundraising for the past couple of years has been softer than we've expected, but it's picking up now. Now is an appropriate time to make the changes necessary to augment our leadership team.
p. 8 · Read in context →
The engineering backlog rule, and the public/private client mix meant to carry it through cycles.
Stephen MacLeod (BMO Capital Markets); Christian Mayer (CFO, Colliers International): We always strive to maintain a backlog in excess of 12 months of revenue. That continues to be the case today, regardless of the fact we've increased revenue significantly. That backlog needs to grow significantly as the revenue on the trailing 12 basis grows in the business. We are able to do that. We are having success with gaining wins on contracts for new infrastructure projects, larger-scale type projects as well in the private sector. We feel very confident about our pipeline of revenue in that business and where it's tracking, right where we expect it to be in terms of our planning. We also strive to maintain a mix of private sector and public sector clientele in the segment. We look at that carefully, and that balance gives our revenues additional resilience through all cycles of the economy, and that's something we strive to do as well.
p. 9 · Read in context →
Q3 2024 Earnings Call — Q3 2024
The call that both redrew the reporting segments and cut the profit outlook — and explained, number by number, how each segment converts revenue into EBITDA. · Open the full transcript →
The quarter the reporting segments were redrawn, with the long-run growth and return record management cites.
Jay Hennick (Chairman and CEO, Colliers International): This quarter, Colliers realigned its operating segments to better reflect the future potential and value of our complementary growth engines, and we delivered solid growth across each one of them. […] Through the Colliers Way, we have continued to strengthen our commercial real estate operations around the world while adding new growth engines and service lines to provide more recurring revenue streams and diversification to our successful business model. Today, recurring revenues contribute more than 70% of our earnings, providing exceptional balance and predictability, driving greater shareholder value now and into the future. […] With experienced leadership, significant inside ownership, and a proven 30-year record of delivering 20% annualized returns for shareholders, we expect to sustain mid to high single-digit growth going forward, and as we enter 2025, we expect further upside to come from improving capital markets
p. 5 · Read in context →
The guidance cut stated plainly, and what in the model was already fixed by November.
Christian Mayer (CFO, Colliers International): We have revised our outlook based on our year-to-date operating results and our updated fundraising expectations for the fourth quarter, as I noted a moment ago. With less than two months remaining in the year, our investment management results are essentially locked within a tight range. […] Our expectation for adjusted earnings per share growth is being impacted by the mix of earnings and higher-than-planned depreciation expense due mainly to technology investments.
p. 7 · Read in context →
Why a fundraising shortfall moves earnings so hard: 40%-50% incremental EBITDA margin on new commitments.
Stephen Sheldon (William Blair); Christian Mayer (CFO, Colliers International): can you just walk through the moving pieces for the profit guide reduction? How much of that is due to lower fundraising and expected profit in IM? And it also sounds like you're reinvesting in an RES to support the growth outlook there. So maybe how much more are you reinvesting there, maybe relative to what you'd included in the guidance last quarter? Just more detail on the moving pieces in the profit guide. […] Yeah, Steven. So I think as we noted in our comments and in the press release, the adjustment to the earnings outlook is entirely due to investment management fundraising. And to give you a bit more color on investment management, the capital commitments that are generated in any given year become accretive to revenues in a modest way and to EBITDA in a very significant way because of the high incremental margins on this, in the range of 40%-50% incremental EBITDA margin.
p. 7 · Read in context →
The capital cycle: harvest gains, return capital to LPs, and use the distribution to raise the next vintage.
Jimmy Shan (RBC Capital Markets); Christian Mayer (CFO, Colliers International): Yeah, Jimmy, we have been deploying capital this year, but we've also been, and we noted it last quarter, we've also been harvesting gains in our portfolios. So we do have certain older vintage funds that are nearing the end of their lives, and those are funds where you take the opportunities to selectively sell assets and realize those gains and return that capital to investors. […] That's the capital cycle, and it certainly facilitates future fundraising for us. And we did have some more of that activity in the third quarter. We expect that activity to continue, deploy new capital, and then also harvest gains and realize gains on existing investments and recycle that capital to investors. And that will lead to additional fundraising going forward because that is a very positive signal, obviously, for our LPs.
p. 9 · Read in context →
Incremental margin by service line: about 20% on brokerage revenue, diluted by valuation and property management.
Jimmy Shan (RBC Capital Markets); Christian Mayer (CFO, Colliers International): In terms of the Real Estate Services margin, pointed out the flat margins, sounds like it's aggressive recruiting. So how do we think about the operating leverage going forward now with, if we see continued recovery, do we expect that? How do we think about that margin? […] So our real estate services business, just to pull back a bit here, we've got leasing, capital markets, and outsourcing, three different service lines. Our leasing and capital markets business, as we generate additional revenues there, we do expect incremental margins in the order of about 20% on an incremental revenue dollar. […] But that is, when you look at the real estate services segment, it's muted somewhat by the incremental margins coming from valuation or from property management, which are more modest in nature.
p. 9 · Read in context →
The number behind 'recurring': on average 85% of returned LP capital comes back into the next fund.
Himanshu Gupta (Scotiabank); Jay Hennick (Chairman and CEO, Colliers International): Well, again, we'll give you a better outlook in February. But generally speaking, when funds are initiated, it takes a quarter or two for investors to re-up. Remember, as you pay back these investors in every fund, 85% on average return into the following fund. So not only is this a recurring revenue business, but fund to fund, as long as you continue to provide good results for investors, investors tend to re-up into the following, into the subsequent vintages.
p. 11 · Read in context →
Q4 and Full Year 2022 Earnings Call — Q4 2022
The stress test: with Americas capital markets down 51%, management had to show which earnings actually recur — and still gave a full-year guide. · Open the full transcript →
A rare like-for-like bridge: why the segment's adjusted EBITDA equals the fee-related earnings pure-play managers report.
Christian Mayer (CFO, Colliers International Group): Fourth quarter investment management revenues were $121 million, up 53%. Excluding passthrough carried interest, revenues were up 87%, driven by acquisitions and management fee growth from increased assets under management. Adjusted EBITDA for the quarter was $53 million, up 88% relative to the comparative quarter. For reference, our reported adjusted EBITDA is equivalent to fee-related earnings, or FRE, that many pure play IM firms report since our IM earnings are generated from recurring management fees.
p. 5 · Read in context →
Guidance given into a collapsing transaction market, with the cost lever named explicitly.
Christian Mayer (CFO, Colliers International Group): There are three broad themes to our outlook. One, recurring investment management revenues are expected to grow significantly from continued capital raising for several products we have in the market right now, as well as the annualization of recent acquisitions. Two, recurring outsourcing and advisory operations are expected to continue to grow organically, as well as from the annualization of recent acquisitions. Three, we expect capital markets activity to be down 20%-40% during the first half of 2023, relative to strong prior year comparatives, with a return to year-over-year growth in the second half. […] We expect to maintain disciplined cost control through this period with tight management of discretionary expenses and by gearing our support and administrative staffing levels to match expected revenues.
p. 5 · Read in context →
An analyst reverse-engineers the guide to flat organic EBITDA; the CFO corrects the acquisition math.
Michael Doumet (Scotiabank); Christian Mayer (CFO, Colliers International Group): I wanted to dig into the 2023 EBITDA guidance just a little bit. My math tells me, you know, assuming $100 million of incremental EBITDA from the deals that you have closed at the midpoint of the 2023 EBITDA guidance essentially implies flat organic EBITDA. First, is that thinking correct? Then second, just broadly is the idea that, you know, leasing O&A and IM effectively offset capital markets. […] A great question, Michael. First off, the EBITDA from the annualization of acquisitions is more like $75 million, not $100 million. You need to dial that into your organic growth assumptions, which will, I think, take those assumptions a bit higher. That's my key observation to your comment.
p. 5 · Read in context →
The hardest question of the downturn — deals cancelled or merely delayed — answered without spin.
Stephen Sheldon (William Blair and Company); Jay Hennick (Global Chairman and CEO, Colliers International Group): I guess, are you seeing any signs of deals getting pulled or canceled altogether, or does this truly seem just like a timing delay where transactions are taking longer and where there could be a wall of pent-up activity that could unlock in the second half of this year and potentially into 2024? […] Well, I think it's definitely transactions have been canceled, and for all the reasons you'd expect, interest rates, availability of capital, you know, near term expectation that a building was worth $X six months ago, and it's worth substantially less today. There is huge pent-up demand, at least we see it. We see it in Europe, actually. The smaller transactions, the smaller buildings are moving, are trading. We think there's a big pent-up demand of real estate assets that wanna trade, but they still need a period of time to stabilize, and stabilize both on the on both sides. You know, I think higher quality assets will trade sooner than lesser quality assets. There is a lot of discovery happening. […] It's not just price discovery, it's clients looking at portfolios or ways to acquire two or three assets from a seller who might be under a little bit of financial pressure. I would say our capital markets people are busier today than they've ever been before. It's in an environment where they know the likelihood of near term completing transactions is not as rapid as it was, let's say, a year ago.
p. 6 · Read in context →
Who the LPs are, and why their money rolls forward from one fund to the next.
Stephen Sheldon (William Blair and Company); Jay Hennick (Global Chairman and CEO, Colliers International Group): Yeah, I mean, it is broad across all of the asset classes. You know, we're in very attractive spaces, alternate assets, infrastructure, traditional real estate, multifamily, et cetera. We do a little bit of credit as well. You know, the thing that really surprises a lot of people is that there is, in addition to the fact that, and I commented about this in my comments, that we have a lot of perpetual and long-dated funds. You have to remember that the LPs, and for us, most of the LPs are big institutions. We have just under 1,000 LPs. Very little direct to retail at this point although something we're working on. These LPs have known us and our platforms for a long period of time. […] They move from one fund to another. As the closed-ended funds mature and a new fund is initiated, they move from fund to fund. In addition to the fact that they're long-dated strategies, closed-ended funds, it's the same investors that are going from fund to fund to fund. There's, you know, there's a wonderful cadence of recurability to this business, and we're enjoying it.
p. 7 · Read in context →
Why leasing revenue recurs even in a frozen market: leases have to be renewed regardless of sentiment.
Stephen MacLeod (BMO Capital Markets); Jay Hennick (Global Chairman and CEO, Colliers International Group): Just wanted to turn a little bit to leasing, which you've highlighted in your 2023 outlook, expected to be sort of stable and was stable in Q4. I'm just curious if you can talk a little bit about some of the factors that give you strong visibility into leasing trends in 2023. […] You know, we've said this for a long time. You know, I think if you, if you go back really to the fundamentals of leasing, a lease is five years, 10 years, seven years, whatever the lease term is. During COVID, there was a period of time when landlords, because of the uncertainty, would extend lease terms for a year or two while people, while their tenants got comfortable with, you know, what's the new paradigm, which, by the way, I'm not sure they're comfortable still yet on what the new paradigm is. Ultimately, leases have to be renewed, extended, a move has to take place. So there is a repeatability to leasing that you don't necessarily have, for example, in capital markets.
p. 8 · Read in context →
More calls
Q1 2026 Earnings Call — Q1 2026 · 30 pages · The Ayesa funding package and a second segment realignment between Commercial Real Estate and Engineering, plus the 31-year per-share compounding record. · Open →
Q3 2025 Earnings Call — Q3 2025 · 30 pages · Scale check on engineering five years after entry: annualized revenue and headcount, alongside the dry powder waiting to be deployed in investment management. · Open →
Q1 2025 Earnings Call — Q1 2025 · 26 pages · AUM crosses $100 billion for the first time, and management explains why it set a deliberately cautious outlook entering the year. · Open →
Q2 2024 Earnings Call — Q2 2024 · 26 pages · Capital markets posts its first growth in 24 months, and the Englobe acquisition lifts recurring earnings to 72% — the inflection point of the recovery. · Open →
Q1 2024 Earnings Call — Q1 2024 · 27 pages · The $300 million equity raise that funded the next wave of acquisitions, and the Mid-Atlantic expansion it paid for. · Open →
Q4 and Full Year 2023 Earnings Call — Q4 2023 · 29 pages · The trough year summed up: how management framed a full year of capital-markets decline and what it staked the 2024 recovery on. · Open →
Q4 and Full Year 2021 Earnings Call — Q4 2021 · 24 pages · The cycle peak for comparison — revenue past $4 billion — and the Basalt and Antirion deals that built the infrastructure and European investment platforms. · Open →
Q3 2021 Earnings Call — Q3 2021 · 27 pages · Where the Enterprise 2025 plan was formally announced, with the original targets every later call is measured against. · Open →
Colliers International Group Inc.'s annual reports contain management's most considered account of the business. These are the sections, passages and visual pages worth opening in the originals preserved in Sources.
Colliers International Group Inc. — FY2025 Consolidated Financial Statements (Year ended December 31, 2025) — FY2025
The latest audited statements: the only place Colliers defines its three segments, its revenue lines and the RNCI structure in full. · Open the full document →
Report of Independent Registered Public Accounting Firm — Critical Audit Matters — p. 4 · Read the full section →
PwC names one matter: when brokerage and leasing fees may be booked. It sits on 37% of revenue.
The auditor's single critical audit matter — constraining brokerage and leasing revenue.
As described in notes 2 and 26 to the consolidated financial statements, the Company recognized revenue from real estate sales brokerage services, which makes up a significant portion of capital markets revenue of $885.0 million and leasing services revenue of $1,178.8 million for the year ended December 31, 2025. […] Sales brokerage and leasing services revenue contracts may include terms that result in variability in the transaction price and ultimate revenues earned beyond the underlying value of the transaction, which may include contingencies. Sales brokerage and leasing services revenue is constrained when it is probable that the Company may not be entitled to the total amount of the revenue under the contract, which is associated with the occurrence or non-occurrence of an event that is outside of the Company’s control, or where the facts and circumstances of the contract limit the Company’s ability to predict whether this event will occur.
p. 4 · Read in context →
Consolidated Statements of Earnings — p. 6 · Read the full section →
Shows the gap that defines Colliers: $224.6m of net earnings, $103.1m left for shareholders.
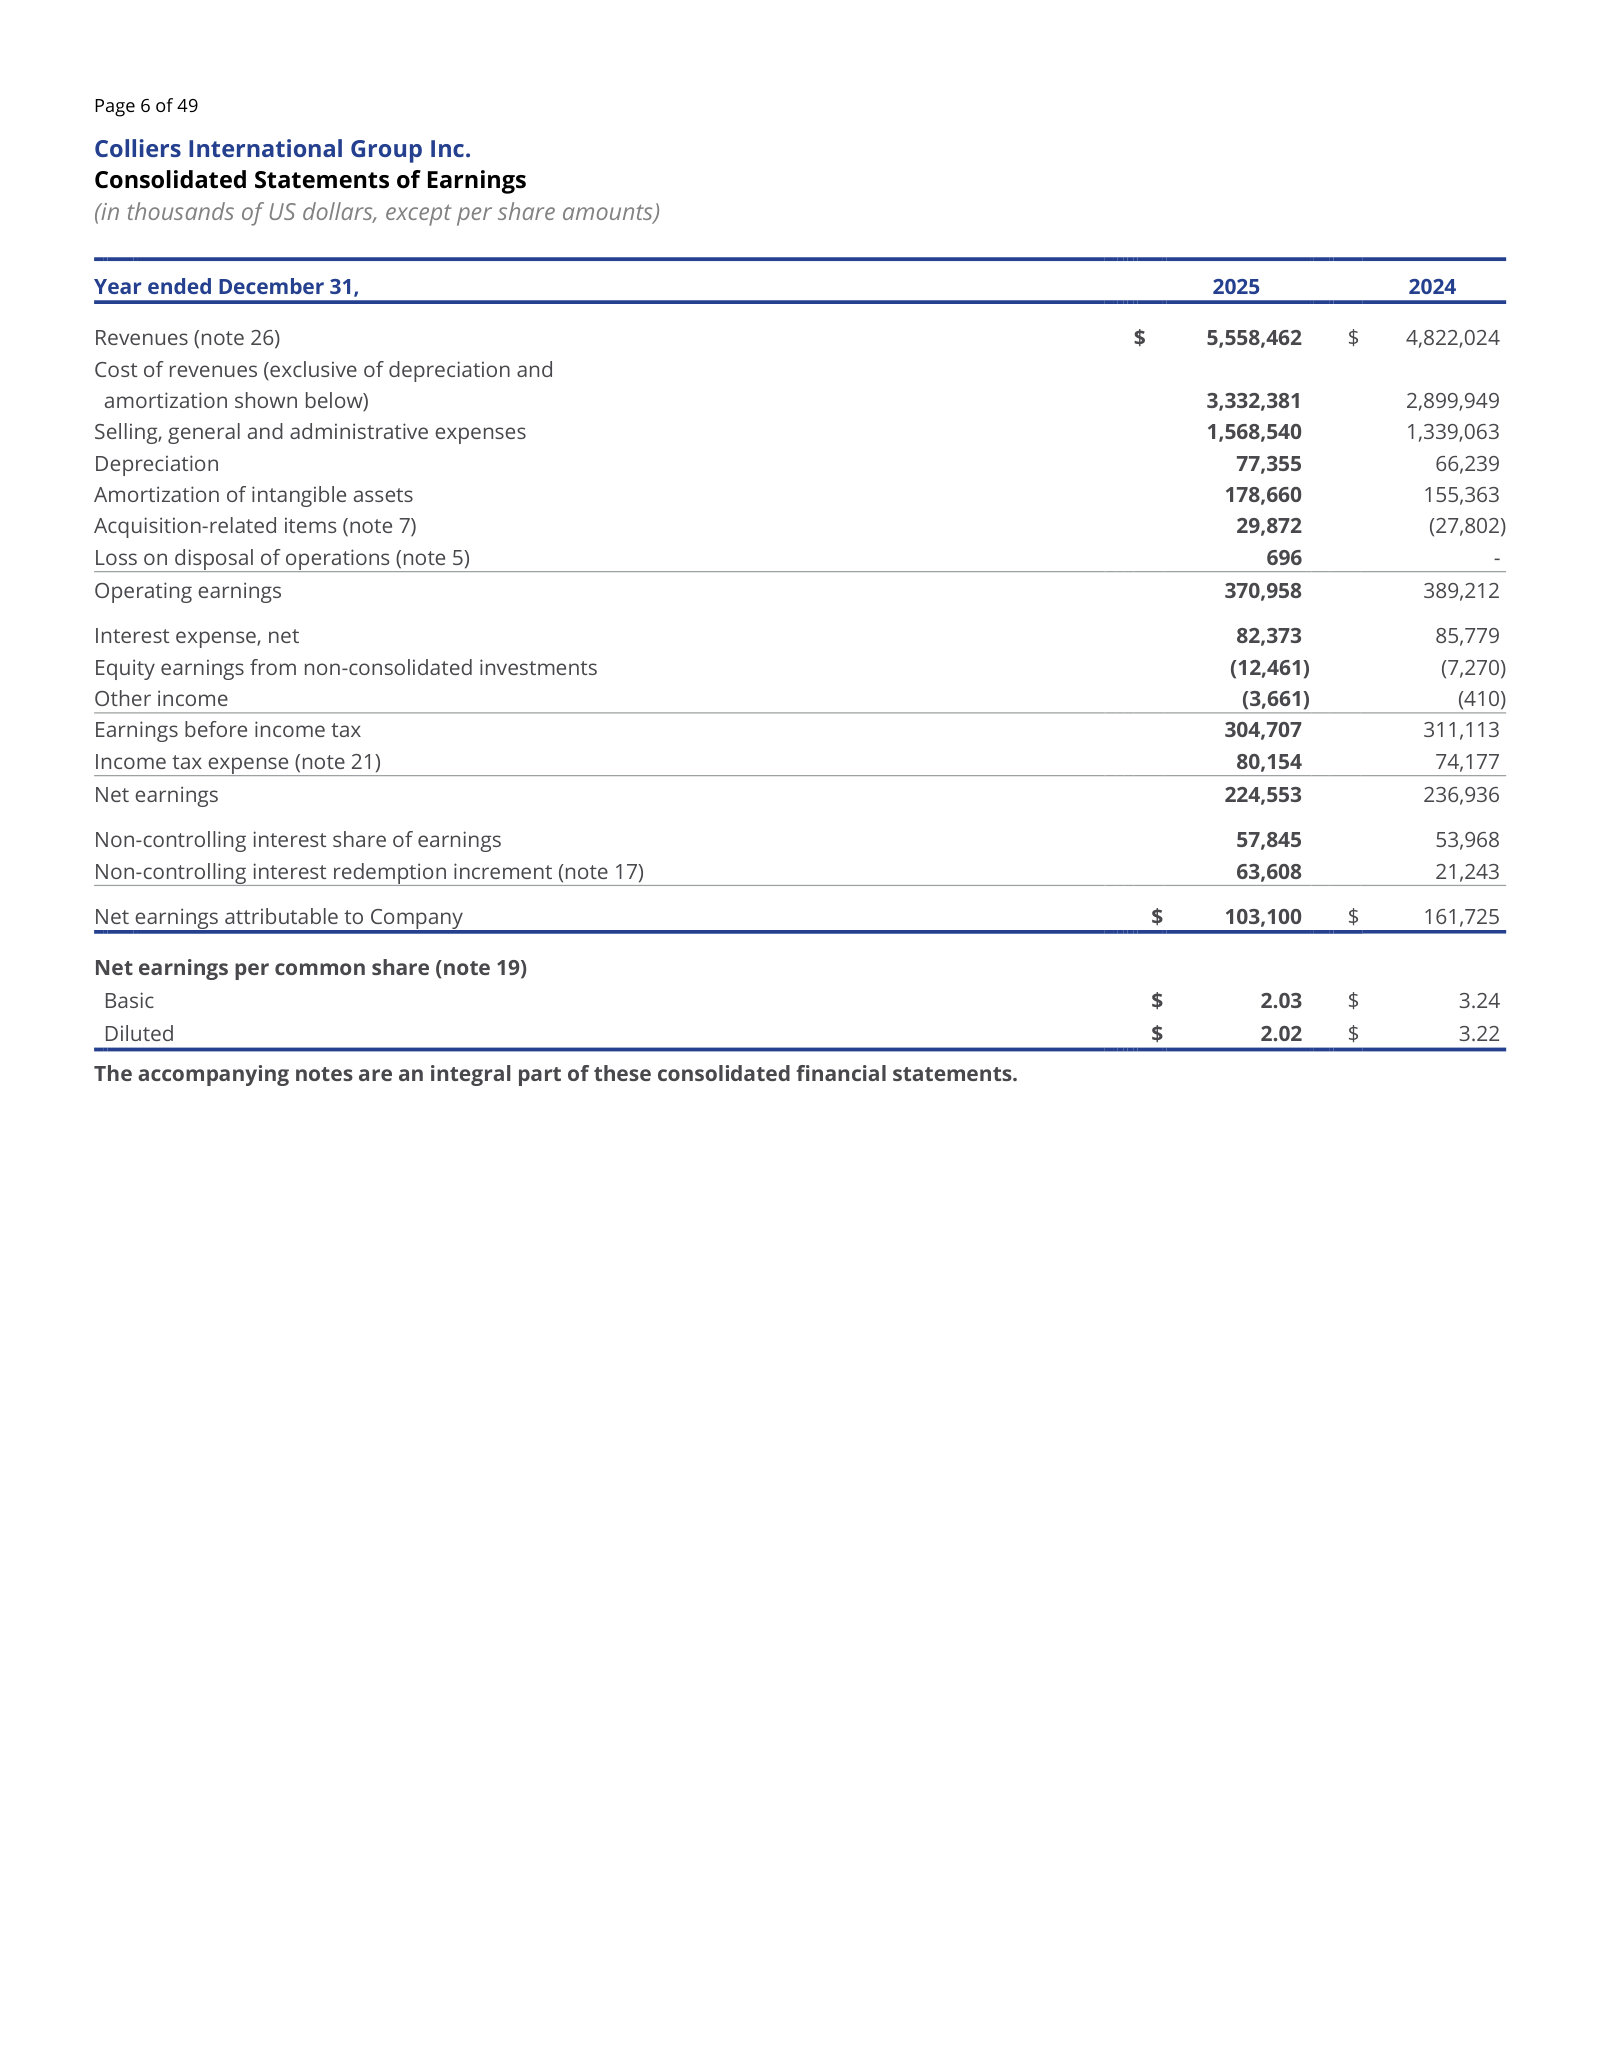
1. Description of the business — p. 11 · Read the full section →
Three paragraphs that set the perimeter: 33 countries, three segments, one renamed this year.
The business as management defines it, with the Real Estate Services segment renamed.
Colliers International Group Inc. (“Colliers” or the “Company”) is a global diversified professional services and investment management company providing services to corporate and institutional clients in 33 countries around the world (70 countries including affiliates and franchisees). Operationally, Colliers is organized into three distinct segments: Commercial Real Estate (previously named Real Estate Services), Engineering and Investment Management (“IM”).
p. 11 · Read in context →
2. Summary of presentation — Revenue — p. 16 · Read the full section →
The five revenue lines in management's own words, from transactional brokerage to recurring fee streams.
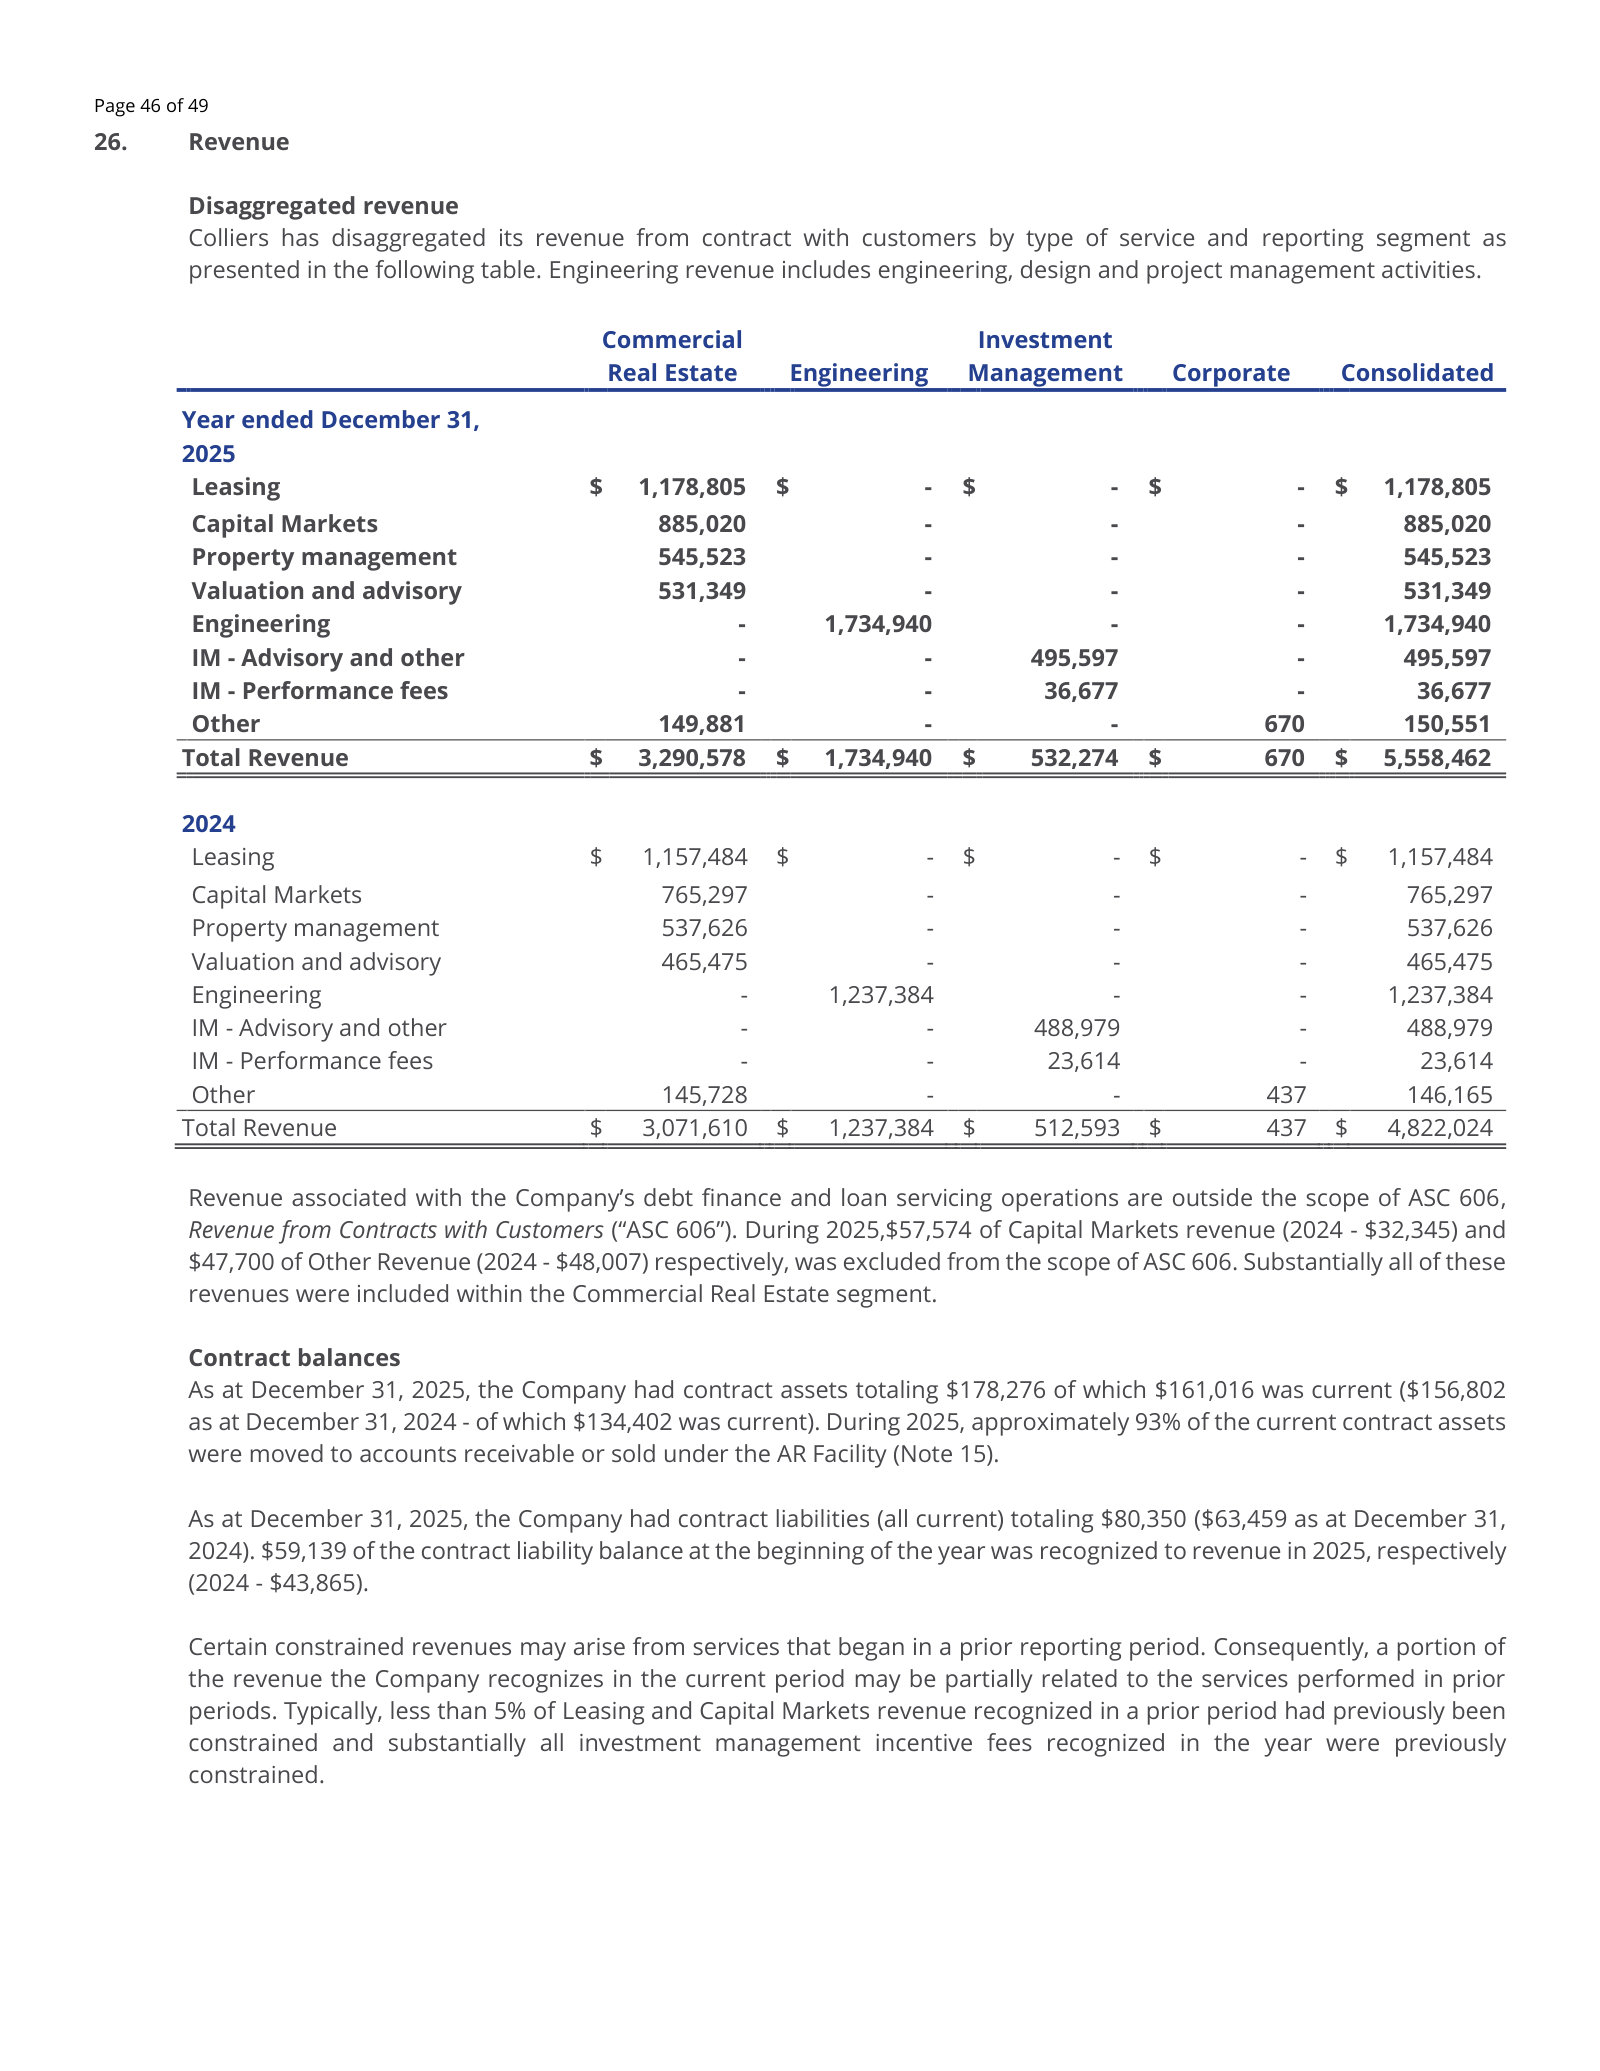
4. Acquisitions — p. 22 · Read the full section →
Eleven deals in one year — the clearest statement of how Colliers actually grows.
The FY2025 acquisition count by segment, and which purchase price allocations remain provisional.
During 2025, the Company acquired controlling interests in eleven businesses, three in Commercial Real Estate, seven in Engineering and one in Investment Management. […] As of December 31, 2025, the Company has not completed its analysis to assign fair values to all identifiable tangible and intangible assets related to Cambium Inc. and Greenhill Engineering Pty Ltd and, therefore, the purchase price allocations for the acquired businesses are provisional and subject to change within the respective measurement period which will not extend beyond one year from the acquisition date.
p. 22 · Read in context →
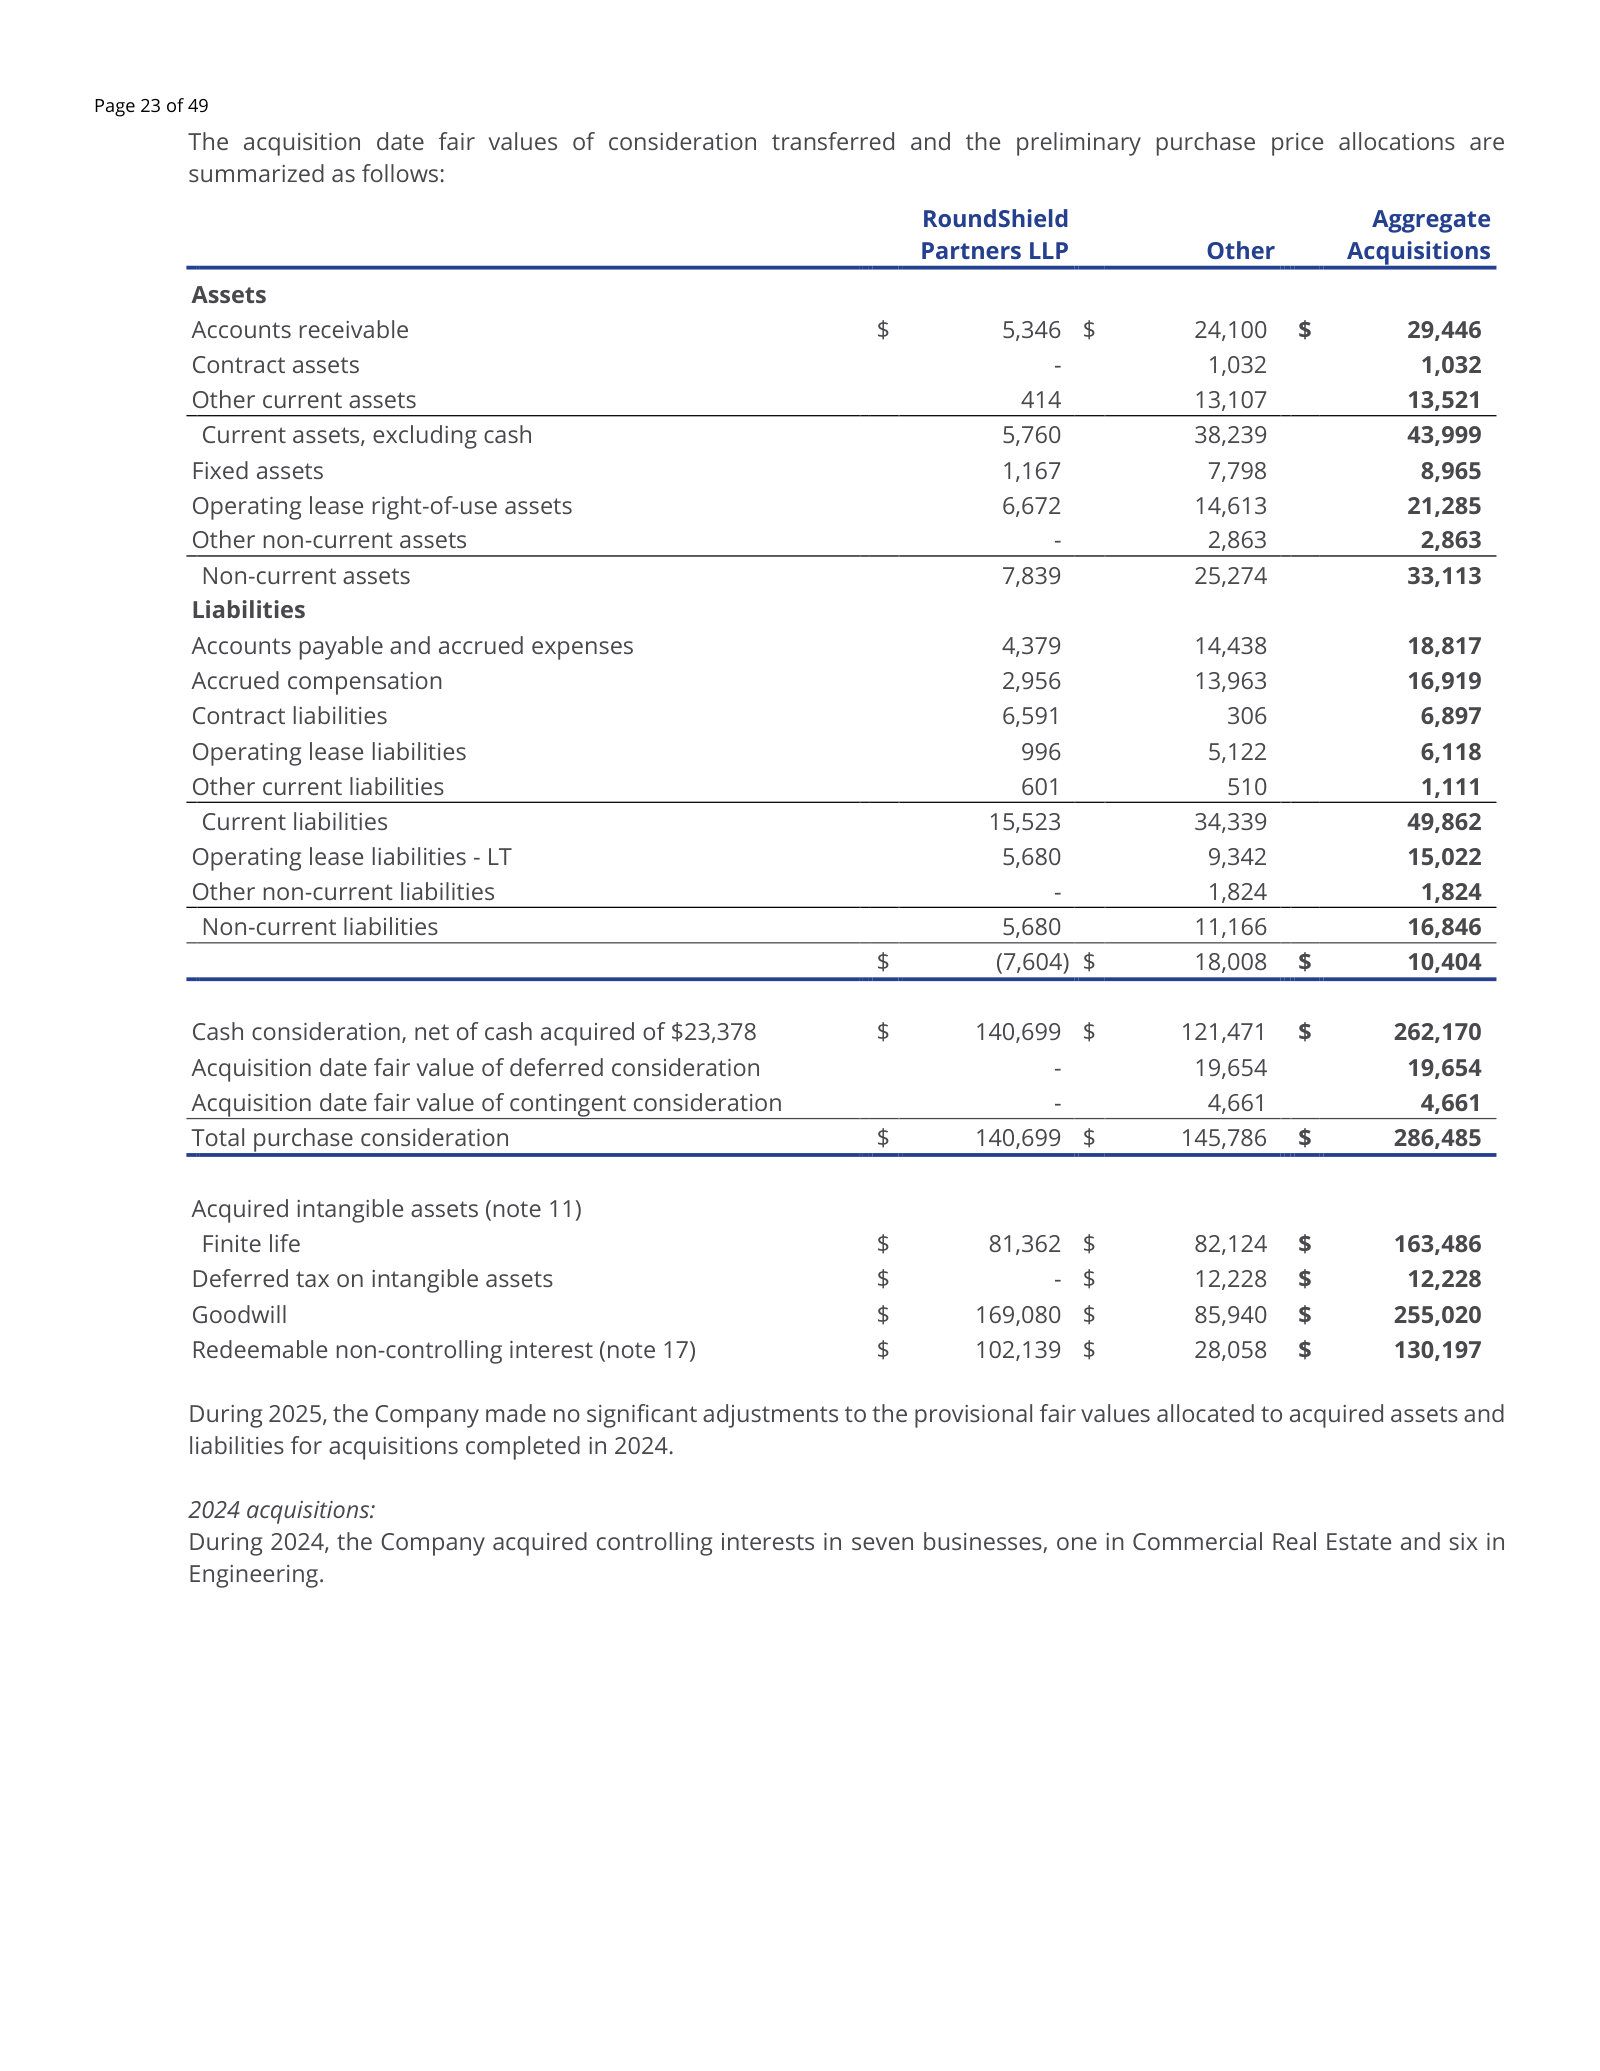
12. Goodwill / 13. Long-term debt — p. 31 · Read the full section →
What serial acquisition leaves behind: $2.63bn of goodwill funded against $1.63bn of debt.
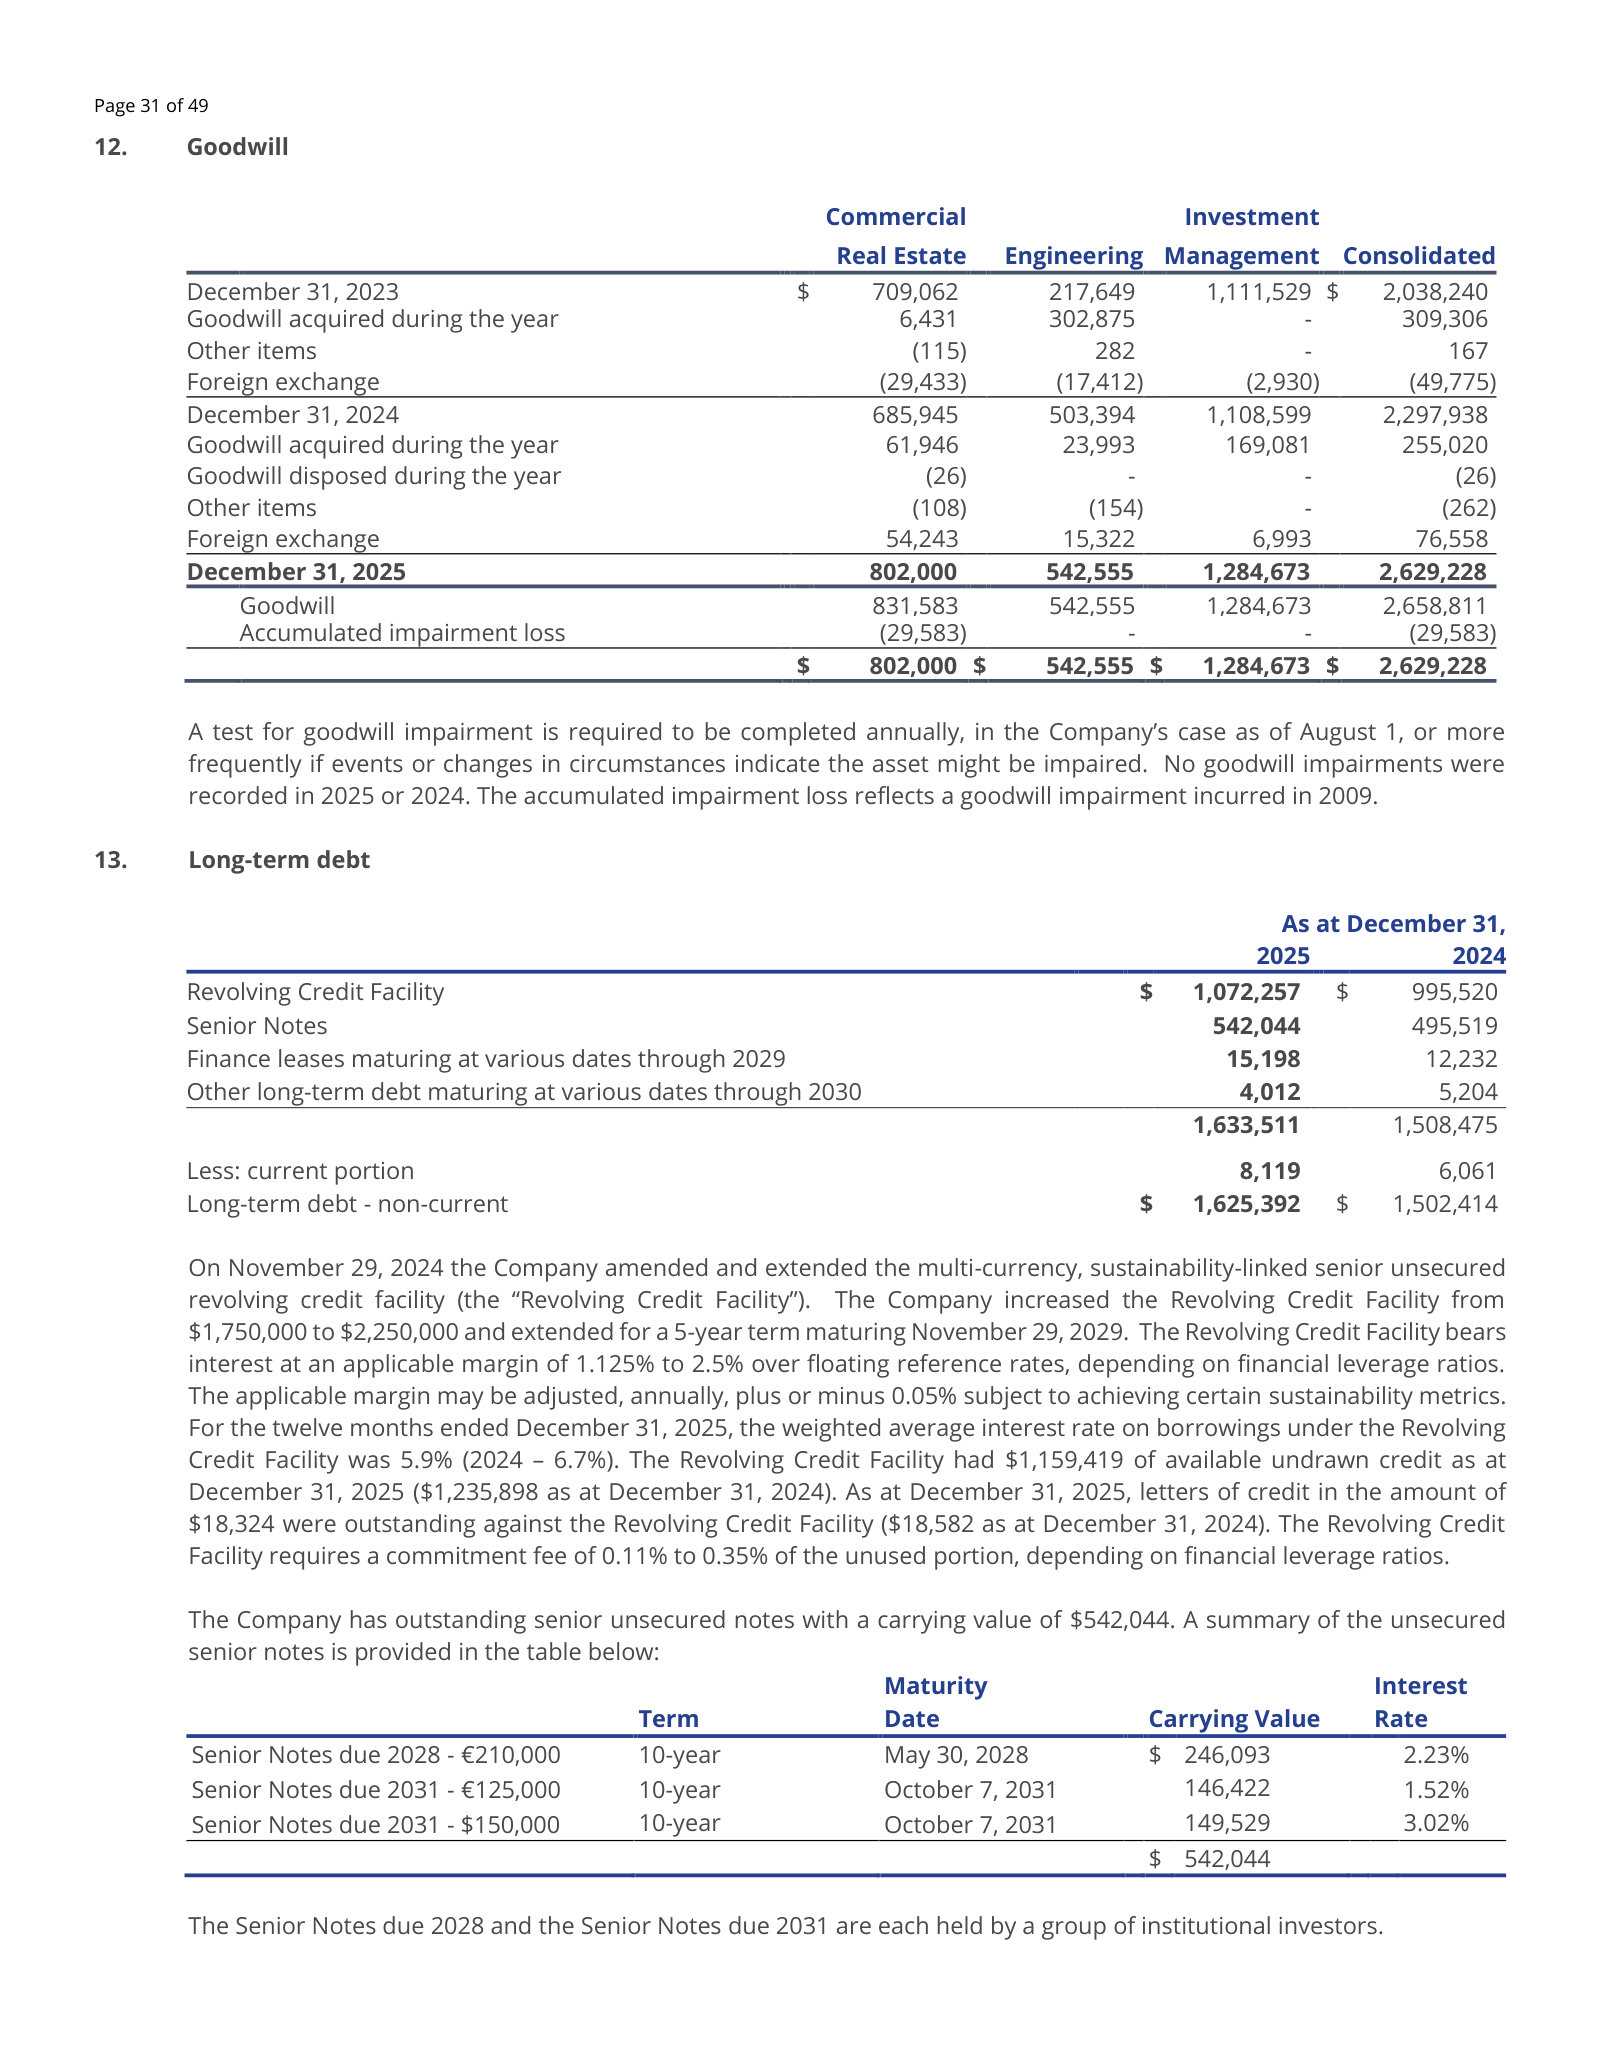
17. Redeemable non-controlling interests — p. 33 · Read the full section →
Local managers own puttable stakes carried at redemption value in the mezzanine — the structural feature most often missed.
Why RNCI sits outside shareholders' equity and is remeasured to redemption value each period.
The minority equity positions in the Company’s subsidiaries are referred to as redeemable non-controlling interest (“RNCI”). The RNCI are considered to be redeemable securities. Accordingly, the RNCI is recorded at the greater of (i) the redemption amount or (ii) the amount initially recorded as RNCI at the date of inception of the minority equity position. This amount is recorded in the “mezzanine” section of the balance sheet, outside of shareholders’ equity. Changes in the RNCI amount are recognized immediately as they occur.
p. 33 · Read in context →
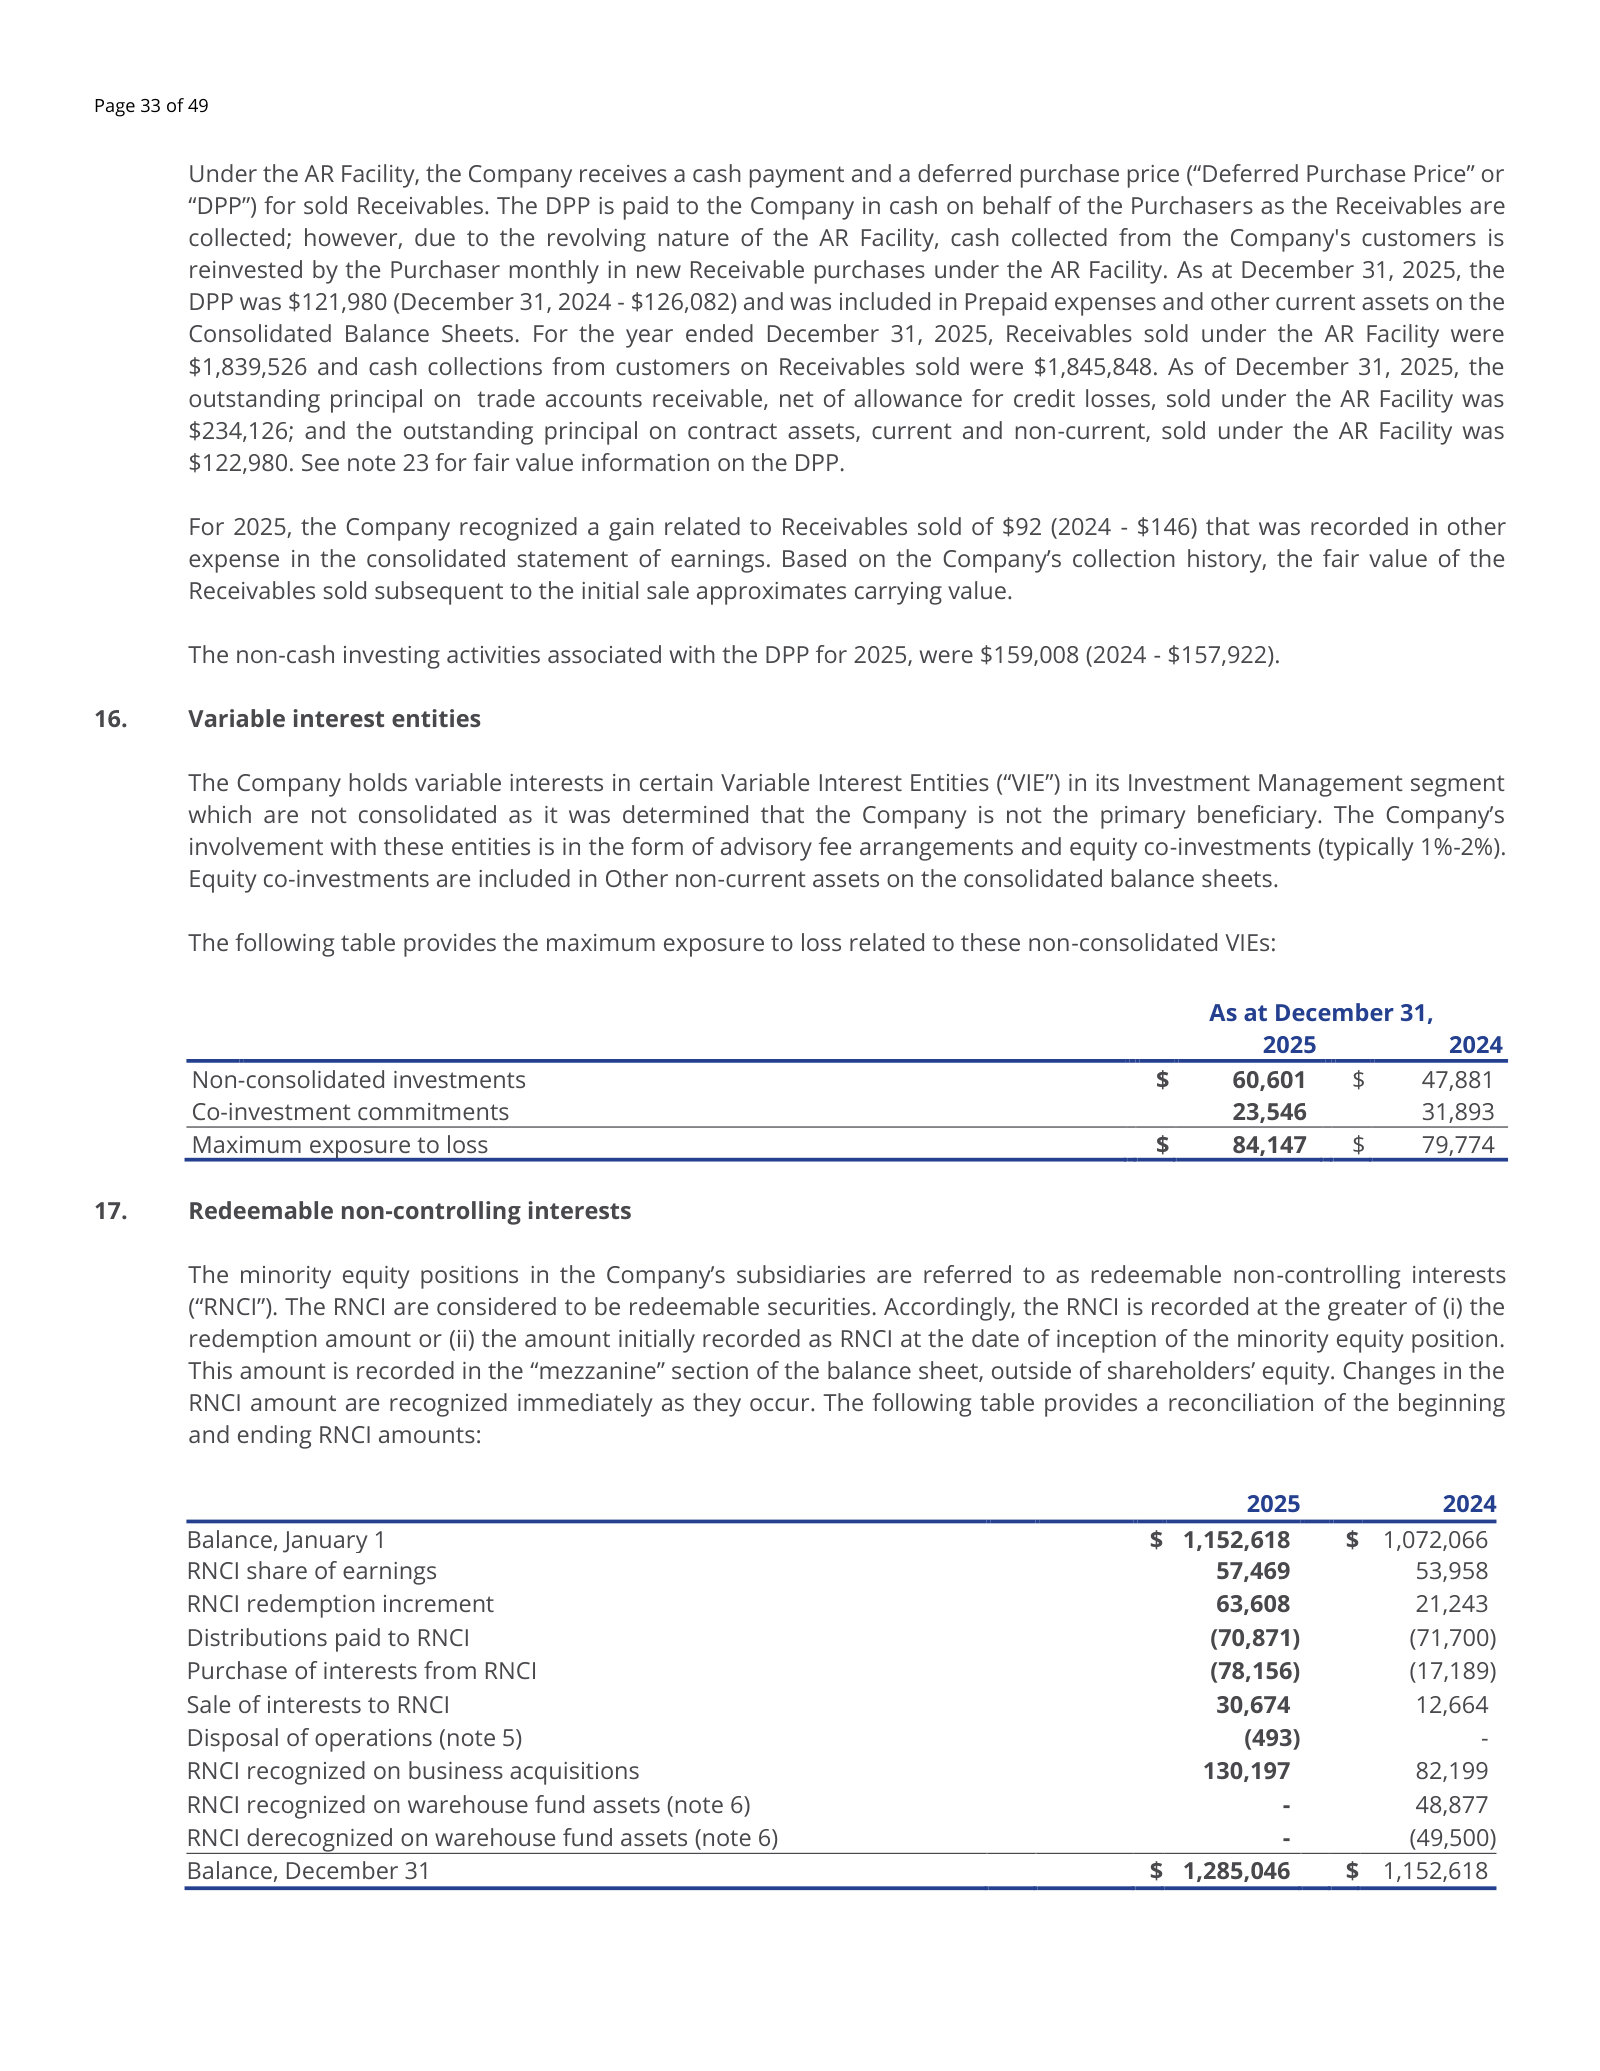
24. Commitments and Contingencies — p. 45 · Read the full section →
A Fannie Mae DUS loss share on $7.2bn of sold loans, reserved at $12.7m — small until it isn't.
Loss-sharing terms and the unpaid principal balance behind the DUS obligation.
Net losses on defaulted loans are shared with Fannie Mae based upon established loss-sharing ratios, and typically, the Company is subject to sharing up to one-third of incurred losses on loans originated under the DUS Program. As of December 31, 2025, the Company has funded and sold loans subject to such loss sharing obligations with an aggregate unpaid principal balance of approximately $7,196,000. (2024 - $5,584,000) As at December 31, 2025, the loss reserve was $12,655 (2024 - $13,556)
p. 45 · Read in context →
27. Segmented information — p. 47 · Read the full section →
Segment Adjusted EBITDA with all nine add-backs listed — the bridge from $746.4m to $371.0m of operating earnings.
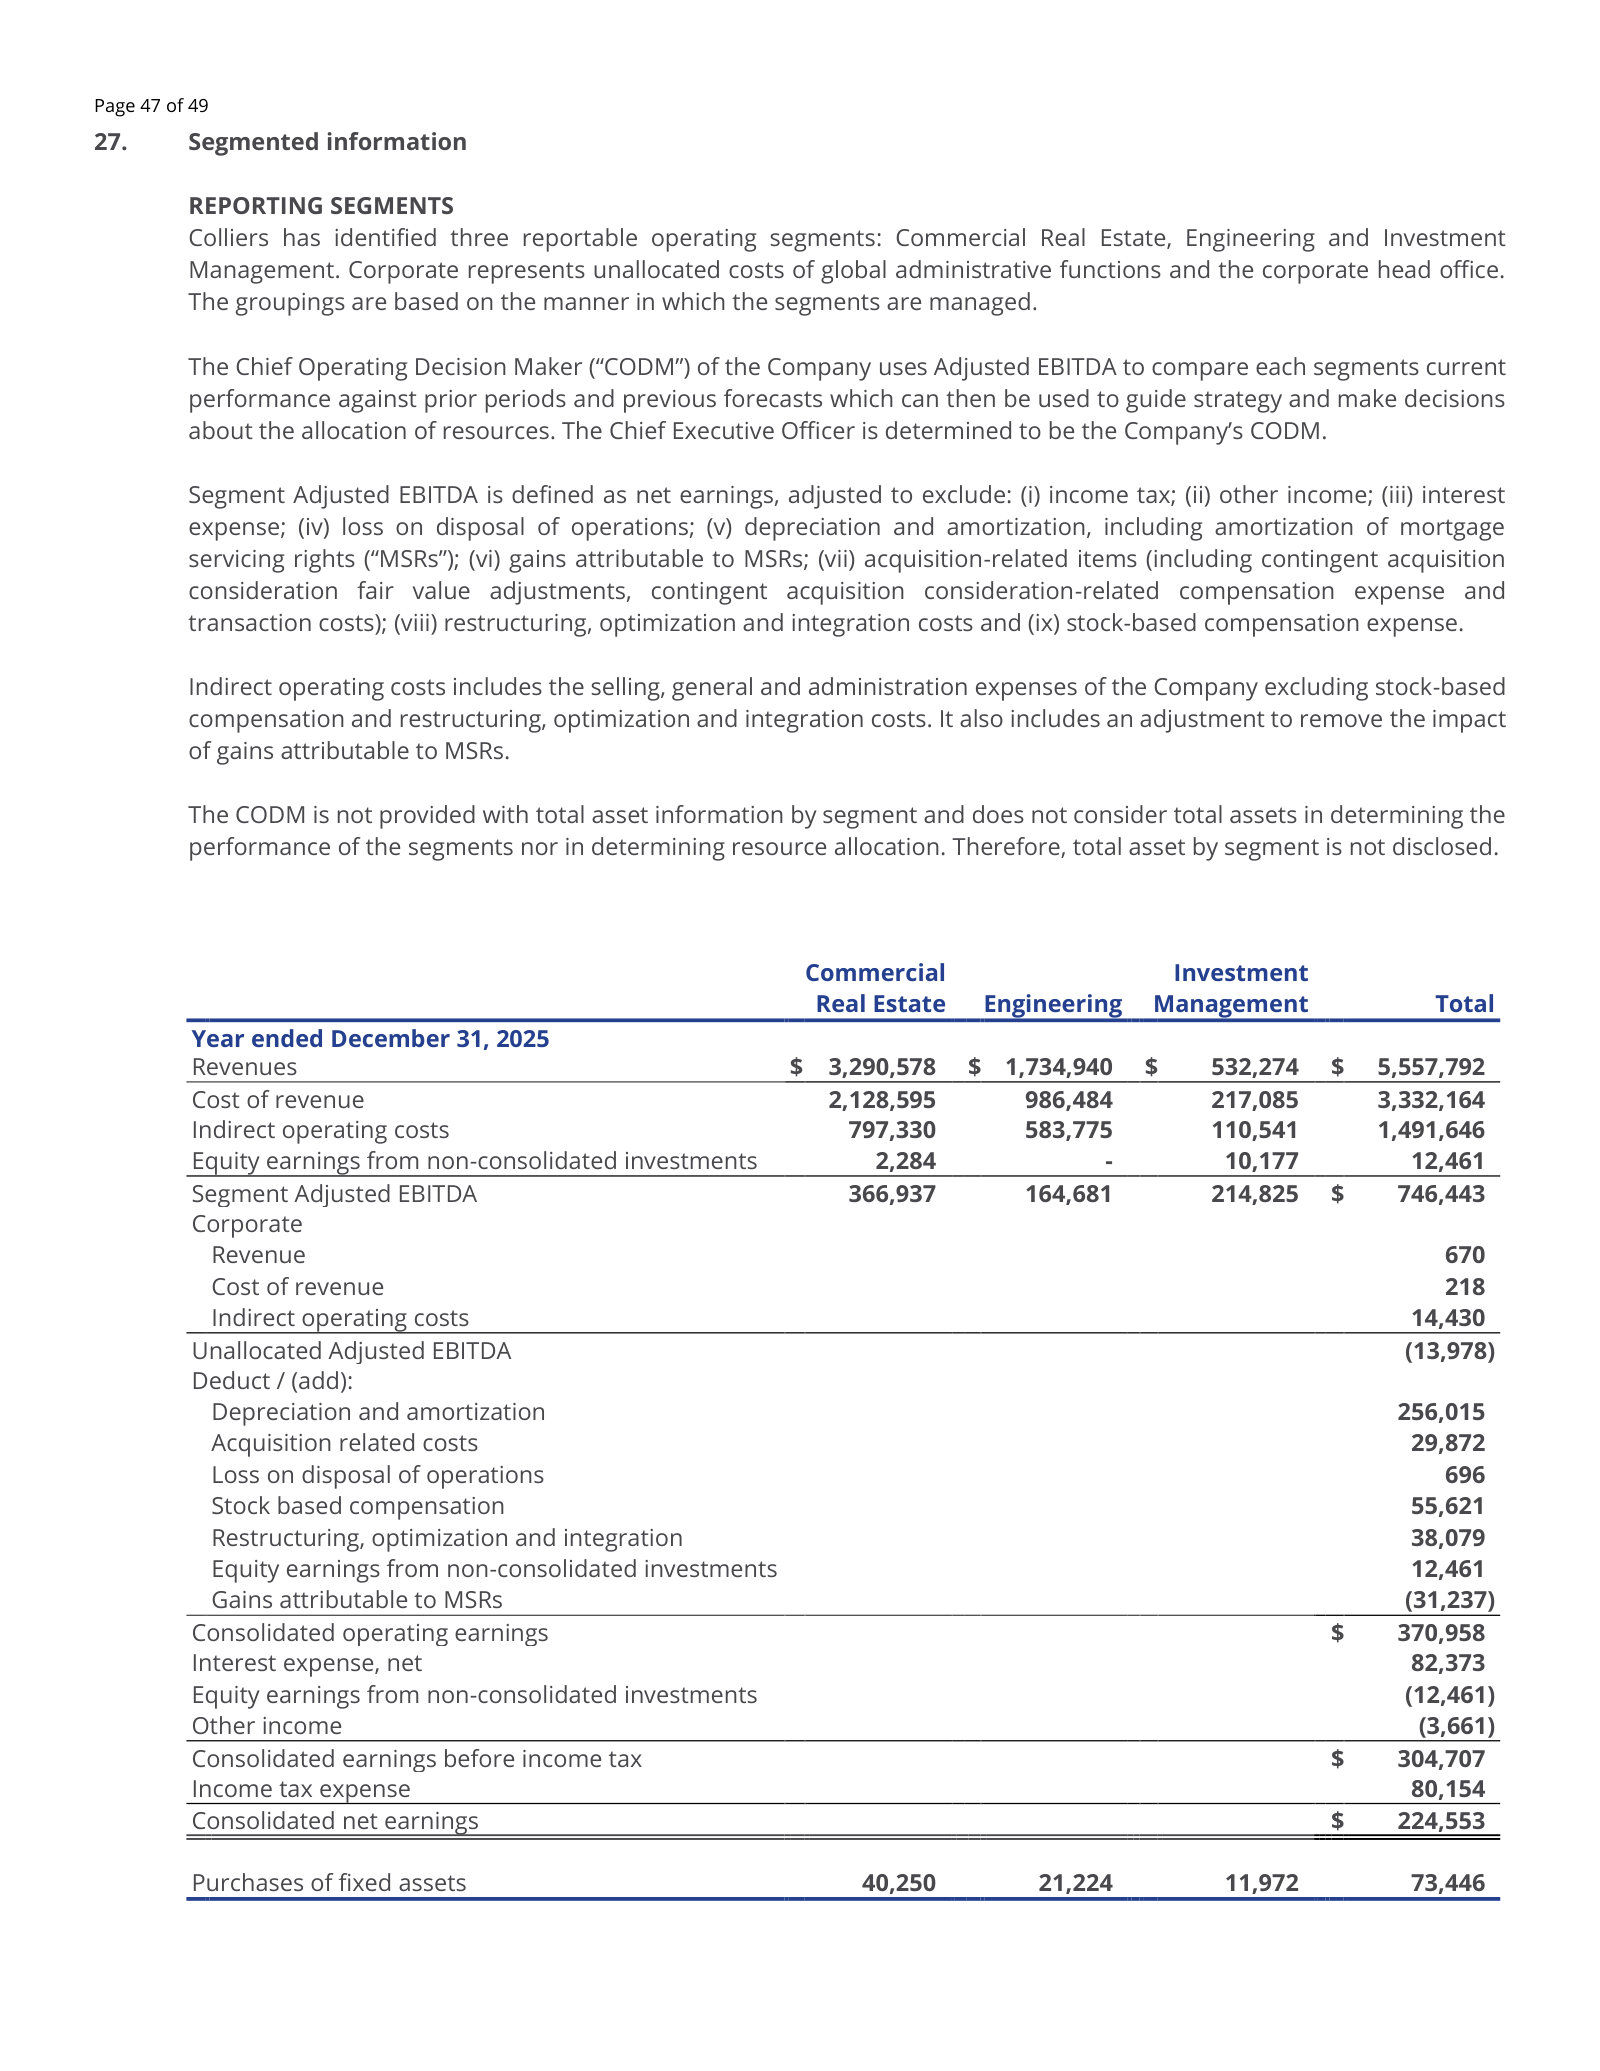
Colliers International Group Inc. — FY2021 Consolidated Financial Statements (Year ended December 31, 2021) — FY2021
Included for one reason: in 2021 Colliers reported four geographic segments and no Engineering business at all. · Open the full document →
1. Description of the business — p. 12 · Read the full section →
The same paragraph as FY2025, four years earlier: 37 countries, four segments, organised by geography.
The FY2021 perimeter — Americas, EMEA, Asia Pacific and Investment Management.
Colliers International Group Inc. (“Colliers” or the “Company”) provides commercial real estate professional services and investment management to corporate and institutional clients in 37 countries around the world (64 countries including affiliates and franchisees). […] Operationally, Colliers is organized into four distinct segments: Americas; Europe, Middle East and Africa (“EMEA”); Asia and Australasia (“Asia Pacific”) and Investment Management.
p. 12 · Read in context →
More annual reports
Colliers International Group Inc. — FY2024 Consolidated Financial Statements — FY2024 · 50 pages · First year with Engineering as a reported segment; carries a second critical audit matter on the Englobe intangibles. · Open →
Colliers International Group Inc. — FY2023 Consolidated Financial Statements — FY2023 · 45 pages · The last year reported on the old segment basis, useful for bridging to the FY2024 restatement. · Open →
Colliers International Group Inc. — FY2022 Consolidated Financial Statements — FY2022 · 49 pages · Peak capital markets year, and the last set to carry the convertible notes accounting policy. · Open →
Competitors describe Colliers International Group Inc.'s market in their own filings and calls. These verified passages and visual pages show where their strategies meet, using source documents preserved in Sources.
CBRE Group, Inc. (CBRE)
The industry's largest firm and the only competitor that meets Colliers in all three of its segments at once: Advisory Services against Colliers' leasing, capital markets and valuation lines; Turner & Townsend against Colliers Engineering; and a $155.5bn investment-management platform against Colliers IM. CBRE is also roughly seven times Colliers' size, so its filings state the scale-advantage case that Colliers has to answer.
CBRE's self-description at the top of its FY2025 annual report. Note what it claims the advantage rests on — absolute scale, integrated delivery across 100-plus countries, and a central research/data/technology platform funded off the balance sheet. These are the same three claims Colliers must rebut with a partnership model and a narrower footprint.
CBRE is the world’s largest commercial real estate services and investments firm (based on 2025 revenue). We derive competitive advantage from our considerable scale and ability to offer integrated solutions for real estate investors and occupiers in more than 100 countries. We are global market leaders in most of our business lines and drive significant growth by helping clients optimize real estate costs, value, investment returns and workplace experiences. These capabilities, combined with our extensive knowledge platform (research, data, strategy, etc.), allow us to generate superior outcomes for our clients, which included nearly 90% of Fortune 100 companies and many of the world’s largest institutional real estate investors in 2025. […] Our platform – the resources and infrastructure that support our professionals and underpin our growth, such as research, marketing, data and technology – combined with our balance sheet strength, provide us access to top talent and compelling growth opportunities.
p. 4 · Read in context →
CBRE's formal Competitive Positioning disclosure. It splits the field into "a handful of well-established globally diversified real estate services firms that are smaller than CBRE" — the bracket Colliers sits in — and local specialists, and argues that client consolidation of vendor lists works in the largest firm's favour. This is CBRE's stated view of the structural trend, not an established fact.
Because of the range of services we provide and numerous markets we serve, we encounter a wide variety of competitors. These range from a handful of well-established globally diversified real estate services firms that are smaller than CBRE to many specialists that operate in specific geographies or business lines. Despite this competition, we are the market leaders in most of our business lines, with significant opportunities for continued growth. These opportunities result from the high value our clients place on our scale, in-depth expertise, technology and data-led insights, as well as their increasing preference for consolidating the number of service providers, which plays to our advantage in delivering integrated solutions globally. Our leadership across a wide spectrum of asset classes, including secular growth sectors like logistics and data centers, provides a diversified platform that is resilient across market cycles. Our strong balance sheet enables significant investments in our platform, market-leading talent recruitment and transformational M&A execution. […] At December 31, 2025, we had more than 155,000 employees (including Turner & Townsend employees) worldwide.
p. 8 · Read in context →
Where CBRE's segment architecture overlaps Colliers' other two legs. Turner & Townsend (70%-owned since the January 2025 merger) is the project-and-cost-management business that sits alongside Colliers Engineering, and CBRE Investment Management reports $155.5bn of AUM against Colliers IM. The first passage is CBRE's framing of the outsourcing-consolidation tailwind it says favours scale platforms.
This segment benefits from multiple tailwinds, most notably an increased desire for large occupiers and investors to outsource and consolidate real estate services to optimize costs, operational efficiencies and workplace experiences. […] Our Project Management segment delivers program management, project management and cost consultancy services globally through Turner & Townsend, our majority owned subsidiary, which we acquired in 2021. In January 2025, we merged our wholly owned CBRE project management services business into Turner & Townsend and established Project Management as a separate business segment and now own 70% of the combined entity. […] With $155.5 billion in assets under management as of December 31, 2025, CBRE Investment Management (IM) is one of the leading investment platforms for global real assets. IM invests capital on behalf of pension funds, insurance companies, sovereign wealth funds, and other institutional investors in real estate, infrastructure, master limited partnerships and other assets.
p. 6 · Read in context →
Jones Lang LaSalle Incorporated (JLL)
The other full-line global platform that pairs brokerage and outsourcing with a large investment manager (LaSalle), making it the closest structural analogue to Colliers' CRE-plus-IM combination. JLL names Colliers as a primary competitor in its own 10-K, and its management has publicly staked out a growth stance — organic first, M&A only opportunistically — that runs directly against Colliers' acquisition-led model.
JLL's competition disclosure, which names Colliers as one of five primary global rivals. Two things to take from it: JLL attributes its own position to consolidation while still calling the industry fragmented, and it lists a long tail of non-traditional entrants — banks, accounting firms, software companies and in-house corporate teams — as competitors. The FY2025 edition repeats the fragmentation language but drops the named-competitor list.
We operate across a wide variety of highly-competitive business lines within the commercial real estate industry globally. Our significant growth over the last decade, and our ability to take advantage of the consolidation which has taken place in our industry, have made us one of the largest commercial real estate services and investment management providers on a global basis, though the industry remains fragmented […] Increasingly, we also see companies who may not traditionally be considered real estate service providers, including investment banking firms, investment managers, accounting firms, technology firms, software-as-a-service companies, firms providing co-working space, firms providing outsourcing services of various types (including technology, food service and building products) and companies that self-perform their real estate services with in-house capabilities, entering the market. Some of our primary competitors include large national or global firms including CBRE Group Inc., Cushman & Wakefield plc, Colliers International Group Inc., Savills plc and Newmark Group Inc.
p. 17 · Read in context →
JLL's stated case for why scale plus proprietary data is converting into share. The growth and margin figures are reported results; the causal link to "data and AI advantage" is management's interpretation. Relevant to Colliers because it is the same technology-and-scale argument CBRE makes, aimed at the same mid-market and institutional clients.
Christian Ulbrich, President and Chief Executive Officer: The combination of our market-leading advisory businesses and resilient revenue base drove record levels of first quarter revenue and earnings. […] Our data and AI advantage is driving productivity gains, increased market share and strong financial results across these businesses. Increased revenue and our disciplined operating rigor are unlocking strong profit growth and margin expansion. Adjusted EBITDA increased 24% and adjusted EPS was up 56%. […] We have established scale in large, growing and complex end markets through our integrated global service offering. We have the balance sheet, strong cash generation and capital strength and agility to execute targeted capital deployment with a focus on ROIC. And our investments in proprietary data and AI capabilities over the past decade are expanding JLL's competitive advantage.
p. 1 · Read in context →
The clearest capital-allocation contrast in the peer set. JLL says it can compound high-single-digit organic growth without pursuing M&A aggressively, and holds every deployment — including LaSalle investment-management commitments — to a hurdle set by its own buyback. Colliers' model is the opposite: growth bought through acquisitions. Note JLL's read that sellers are nervous on price, which speaks to the deal market Colliers buys in.
Christian Ulbrich, President and Chief Executive Officer: As we stated at our Investor Day, we see significant growth opportunities in our core activities. We will focus on areas we already cover as core services and look for opportunities to increase market share in geographies where our market share may be lower than desired. If there is an attractive M&A opportunity, we will consider it. However, we are confident our organic growth rate will stay at a high single-digit level, so there is no need to pursue M&A aggressively. The M&A market has increased activity in our space and we see some nervousness on the seller side regarding achievable price levels, which may make opportunities more attractive in the coming six months depending on geopolitical developments. […] Mitch, every use of capital goes through rigorous analysis and must beat our hurdle, which is that it must be better than share repurchases. We looked at the proposals from our LaSalle colleagues, including the last investment and the one we spoke about today, and they are expected to be well above the returns we expect from share repurchases. Expanding LaSalle's footprint has implications beyond LaSalle's P&L, including cross-selling opportunities across JLL's broader platform. So when LaSalle presents a convincing idea with attractive returns, we are comfortable deploying capital to that opportunity.
p. 9 · Read in context →
Cushman & Wakefield Ltd. (CWK)
The peer Colliers most often meets on the same pitch: global, brokerage-and-outsourcing led, with leasing, capital markets and valuation service lines mapped almost one-for-one onto Colliers' Commercial Real Estate segment. It names Colliers as a direct competitor, and — like Colliers — is a challenger to CBRE and JLL rather than the market leader, so its stated strategy is the nearest thing to a control case.
Cushman's market-structure thesis, stated as a revenue driver for "the largest commercial real estate services providers, including us": clients are consolidating vendor lists onto a few global platforms, and "those few firms with scalable operating platforms" capture the share and the margin. It is the same argument CBRE makes at p.8. The open question for Colliers is which side of that line a mid-scale platform falls on.
We operate in an industry where the increasing complexity of our clients’ real estate operations drives demand for high quality services providers. The sector also continues to be fragmented among regional, local and boutique providers. […] Global Services Providers Create Value in a Fragmented Industry. Clients are choosing to outsource commercial real estate services to global firms that can provide a fully integrated platform. Occupiers and investors continue to consolidate their services provider relationships on a regional, national and global basis to obtain more consistent execution across markets and to benefit from streamlined management oversight of “single point of contact” service delivery. Those few firms with scalable operating platforms are best positioned to improve their profitability and market share as real estate occupiers and investors become increasingly global and require commercial real estate services partners that can match their geographic reach and complex real estate needs.
p. 7 · Read in context →
Cushman's competition disclosure. It claims membership of "the three largest global commercial real estate services firms" and puts Colliers in the next tier alongside Newmark — firms with "similar service competencies and geographic footprints." The ranking is Cushman's own; the useful part is the peer set it draws, which is the group Colliers is priced against.
Our experienced management team is focused on accelerating revenue, enhancing earnings per share, continuing to reduce leverage and recruiting and retaining top talent. […] We compete across various geographies, markets and service lines within the commercial real estate services industry. Each of the service lines in which we operate is highly competitive on a global, national, regional and local level. While we are one of the three largest global commercial real estate services firms, as measured by revenue and workforce, our relative competitive position varies by geography and service line. Depending on the geography or service, we face competition from other commercial real estate services providers, outsourcing companies, in-house corporate real estate departments, institutional lenders, insurance companies, investment banking firms, investment managers, and accounting and consulting firms. Although many of our competitors across our larger service lines are smaller local or regional firms, they may have a stronger presence in certain markets. We are also subject to competition from other large national and multinational firms that have similar service competencies and geographic footprints to ours, including Jones Lang LaSalle Incorporated (NYSE: JLL), CBRE Group, Inc. (NYSE: CBRE), Colliers International Group Inc. (Nasdaq: CIGI) and Newmark Group Inc. (Nasdaq: NMRK).
p. 11 · Read in context →
A competitor answering an analyst on producer recruiting — the mechanism by which brokerage share actually moves. Cushman says it is landing Capital Markets and Leasing teams, and points at U.S. industrial as the pool it is recruiting into. The absorption and market-size figures are Cushman's own research. Colliers competes for the same producers in the same markets.
Julien Blouin (Goldman Sachs); Michelle MacKay, Chief Executive Officer: Just wondering on the Leasing results—were pretty impressive in the quarter. Can you remind us how much of that was driven by some of the recruitment initiatives over the last year? And from a recruitment standpoint more generally, how do you feel you stand today across your different segments? […] Thanks, Julien. Good morning. In terms of recruiting in general, we are doing extraordinarily well. We are building out the Capital Markets platform still, but we have had a significant number of hires there. First quarter, we had a significant number of Leasing recruits land as well. In industrial leasing, that has been a consistent bright spot for us over the past two years, so we expect to continue to do some really strong leasing there. We have recently landed some teams in Boston, and our expectation is that fundamentals will continue to be strong in U.S. industrial as minimal supply is out there. Let me give you just a couple of data points around Leasing, and industrial in particular. Demand is accelerating in Q1. Absorption in the U.S. was up 52% year-over-year, so this is a great place to recruit. […] But also importantly, the industrial leasing market is now 80% larger by dollar volume than it was pre-pandemic, and so as those leases roll over, transaction values are going to be significantly higher—so net-net, a tightening market there.
p. 3 · Read in context →
Newmark Group, Inc. (NMRK)
The peer closest in scale to Colliers' Commercial Real Estate segment, and the only one that publishes an explicit estimate of the market both firms are chasing. It is also the sharpest strategic contrast: Newmark grows almost entirely by recruiting producers and has said so in terms that are directly critical of buying firms — the model Colliers runs. It names Colliers as a primary competitor and has begun buying into Canada.
Newmark's sizing of the shared market: a total addressable opportunity it puts at more than $400bn of annual revenue across public and private commercial real estate services firms. This is a competitor's own estimate, disclosed as an industry-trend assumption rather than an audited figure, but it is the only explicit TAM number any of Colliers' listed peers publishes.
We expect the following industry and macroeconomic trends to impact our market opportunity:
Large and Highly Fragmented Market. We estimate that the commercial real estate services industry is a more than $400 billion global revenue market opportunity. This TAM represents the actual and/or potential revenues that are or could be generated annually by public and private commercial real estate services firms.
p. 21 · Read in context →
The fragmentation arithmetic behind the TAM: Newmark estimates the top ten global firms serve under 20% of the potential revenue pool, with the rest sitting in regional firms and in-house departments. Two implications for Colliers — the runway argument cuts both ways (it is available to every scale player), and Newmark flags investment management as a competitor service line it does not offer, which is precisely where Colliers earns its highest-margin income.
The estimated TAM also includes service lines offered by our public commercial real estate services competitors, but that Newmark currently does not, such as investment management. We estimate that less than 20% of the potential revenue in the global commercial real estate services market is currently serviced by the top 10 global firms (by total revenues), leaving a large opportunity for us to reach clients through superior experience and high-quality service, relative to both our larger competitors and the significant number of fragmented smaller and regional companies. We believe that clients increasingly value full service real estate service providers with comprehensive capabilities and multinational reach.
p. 22 · Read in context →
The most direct strategic collision in the corpus. Newmark describes building a 1,200-person European business by hiring rather than acquiring, and its CEO argues that recruiting selects better people than buying a firm wholesale — "the plums as opposed to the pits." That is an explicit knock on the acquisition-led model Colliers runs. It is a competitor talking its own book, and it also concedes the slower ramp that comes with hiring.
Barry M. Gosin, Chief Executive Officer: We have also been very active. We launched Europe 36 months ago. We have 1,200 people in Europe. When we enter a new market, the new market gets excited, because what we bring to the table is a much more talent-friendly, enabling platform. We have done better than we had originally anticipated, and we have opened up Spain and Italy, and we have done a great deal in Germany, the U.K., and France. We are doing it in the Middle East, and we are doing it in Singapore. We are hiring people, and they want to come work for us. As long as the right people want to come to the platform, we are going to continue to hire the right people. It is a really good way to build a platform. In some cases, although the accounting is a little bit different, when you are hiring brokers and it takes time to ramp up, you have the better shot at getting the plums as opposed to the pits—sometimes when you buy a company with a lot of people.
p. 5 · Read in context →
WSP Global Inc. (WSP)
The scaled-up version of the playbook Colliers runs in its Engineering segment (~31% of FY2025 revenue): a Canadian-listed professional-services consolidator growing through disciplined, serial acquisition of engineering and design firms. WSP is several times the size of Colliers Engineering, bids for the same acquisition targets and the same technical staff, and has publicly set out why it thinks scale and domain expertise defend the business against AI substitution.
WSP's own account of the buy-and-build engine: sixteen acquisitions over the 2022–24 plan, five in 2024 alone adding roughly 4,815 people, and POWER Engineers as the platform deal into power and energy. This is the same mechanism Colliers uses in Engineering, executed at a headcount roughly an order of magnitude larger — and it sets the price competition Colliers faces for mid-sized engineering targets.
Staying true to our disciplined approach to acquisitions, we completed five transactions, welcoming approximately 4,815 new colleagues. We further diversified our footprint and capabilities in key market sectors and regions, namely in EMEIA with the addition of Proxion and 1A Ingenieros, in the USA with AKF, and in Canada with Communica. […] Most significantly, we completed the transformational acquisition of POWER Engineers, realizing a pivotal strategic ambition and enabling WSP to become the preeminent pure-play global consulting firm for the world’s energy transition. […] Today, we have a team of approximately 73,000 talented professionals across the globe. […] By completing 16 strategic acquisitions during the three-year cycle, we also expanded our talent pool and deepened our capabilities in strategic areas.
p. 7 · Read in context →
Stantec Inc. (STN)
Colliers Engineering's nearest North American analogue — Canadian-listed, a serial acquirer of the same 1,000-to-2,000-person engineering practices, competing in the same U.S. and Canadian infrastructure, water and buildings markets. Its management has articulated both the client shift towards mega-packages that favours the largest bidders and the thesis that AI pushes sub-scale firms towards consolidators.
Stantec's read on a structural shift in how engineering work is bought: clients bundling many projects into single mandates three orders of magnitude larger than a typical assignment, which narrows the bid list to "the big majors" and, on management's account, brings some pricing power. The pricing-power claim is Stantec's. The threshold question it raises for Colliers Engineering is whether it clears the bar to bid this work at all.
Jonathan Goldman (Scotiabank); Gord Johnston, President and Chief Executive Officer: The larger projects that you're booking in the U.S., is it possible to quantify or maybe directionally talk about how big those projects are relative to the average size project you do in the U.S.? Maybe also if you can talk about how the delivery kind of period or the conversion of those projects would compare to an average size order. Is this part of a bigger trend moving to more complex and larger projects than in the past? […] We are absolutely seeing a number of clients, both in Canada and in the U.S. that are sort of bundling large packages of projects together, in part because rather than them then having to run 10 projects, they run two, for example. But they're much larger. We are seeing the competitive set on those is much different because it's really only the big majors that can pursue those. The competitive set is different, which allows a little bit of pricing power in a number of instances. It's while an average project size might be in the CAD 100 thousand, couple hundred thousand CAD range, these ones could be in the CAD 100 million to a couple hundred million CAD range. […] We have, there's a smaller number of people within Stantec and the industry overall that can manage projects of that size. We're fortunate to have more than our fair share of them.
p. 16 · Read in context →
A consolidator's case for why acquisition supply should keep coming: 1,000-to-2,000-person firms hit a ceiling where IT, cybersecurity, finance and HR need professionalising, and management argues AI raises that investment bar further. Useful to Colliers two ways — it supports the deal-flow assumption behind its own roll-up, and it identifies the same target cohort Colliers is bidding for.
Frederic Bastien (Raymond James); Gord Johnston, President and Chief Executive Officer: Guys, it feels like an engineering firm's ability to seamlessly embed AI with proprietary data will be a major competitive advantage going forward, and I think those, you know, those who invest accordingly will obviously be rewarded. Do you believe that will benefit larger firms like you over the small ones and potentially lead to more, you know, consolidation, acquisition opportunities? […] That is exactly our thesis as well, Frederic, that, you know, as we've talked over the past, some of the firms that have joined us, these 1,000, 2,000 person firms, you know, even before AI, they've got to this level, and then they need to professionalize IT and cybersecurity and finances and HR and such, and they don't have the resources either in terms of skills or finances to support that. They just wanna focus on the work. Now we see AI as even driving that more. That, just the additional investment in resources, both people and financially to get there. Plus, you know, the data probably isn't in common formats and all those things.
I do believe that this will, as we move forward, that AI and some of the things that we see there will continue to drive, more firms in that space towards the consolidators.
p. 12 · Read in context →
More peer documents
Q4_FY2025 — 11 pages · CFO Emma Giamartino's claim of industry-leading margins and consistent above-market growth "so we're consistently gaining market share," plus CBRE sizing its data-centre services business at roughly $2bn for 2026 — the segment Colliers is also chasing. · Open →
Q3_FY2025 — 9 pages · CEO Bob Sulentic describes the "managed brokerage platform" CBRE uses to find and close coverage gaps by market and asset class, and notes Turner & Townsend's North American revenue has more than doubled since 2022 — the producer-recruiting and project-management fronts against Colliers. · Open →
JLL_annual_report_FY2025 — 117 pages · The current-year version of the competition section cited here (p.15): same fragmentation and non-traditional-entrant language, but the named-competitor list including Colliers has been dropped — worth reading alongside the FY2024 text to see what JLL changed. · Open →
NMRK_annual_report_FY2024 — 173 pages · The prior-year Industry Trends section, for whether Newmark's >$400bn TAM estimate and its "less than 20% served by the top 10" penetration figure have moved year over year. · Open →
Q4_FY2025 — 9 pages · The full-year 2025 results call that sets the base for the Q1 FY2026 recruiting and share claims cited here, including the deleveraging path that constrains how hard Cushman can bid for teams. · Open →
Q1_FY2026 — 31 pages · WSP puts soft backlog near CAD 12bn, power at roughly a third of U.S. revenue after the TRC acquisition, claims 75% win rates in data-centre work and a number-one U.S. position in transmission and distribution — the end markets driving engineering demand. · Open →
Q2_FY2026 — 31 pages · CEO states plainly that WSP is growing in the U.K. "at a much faster rate than any of our competitors right now" — an explicit, unquantified share claim against the listed engineering peer group. · Open →