Colliers International Group Inc.'s management explains the business in its own materials. The slides below do the most of that work, pulled from the documents preserved in Sources. Each source link opens the complete presentation at that slide in a new tab.
Management's fullest current explanation of the company: segments, unit economics, strategy and the six-year financial record. · Open the full document →
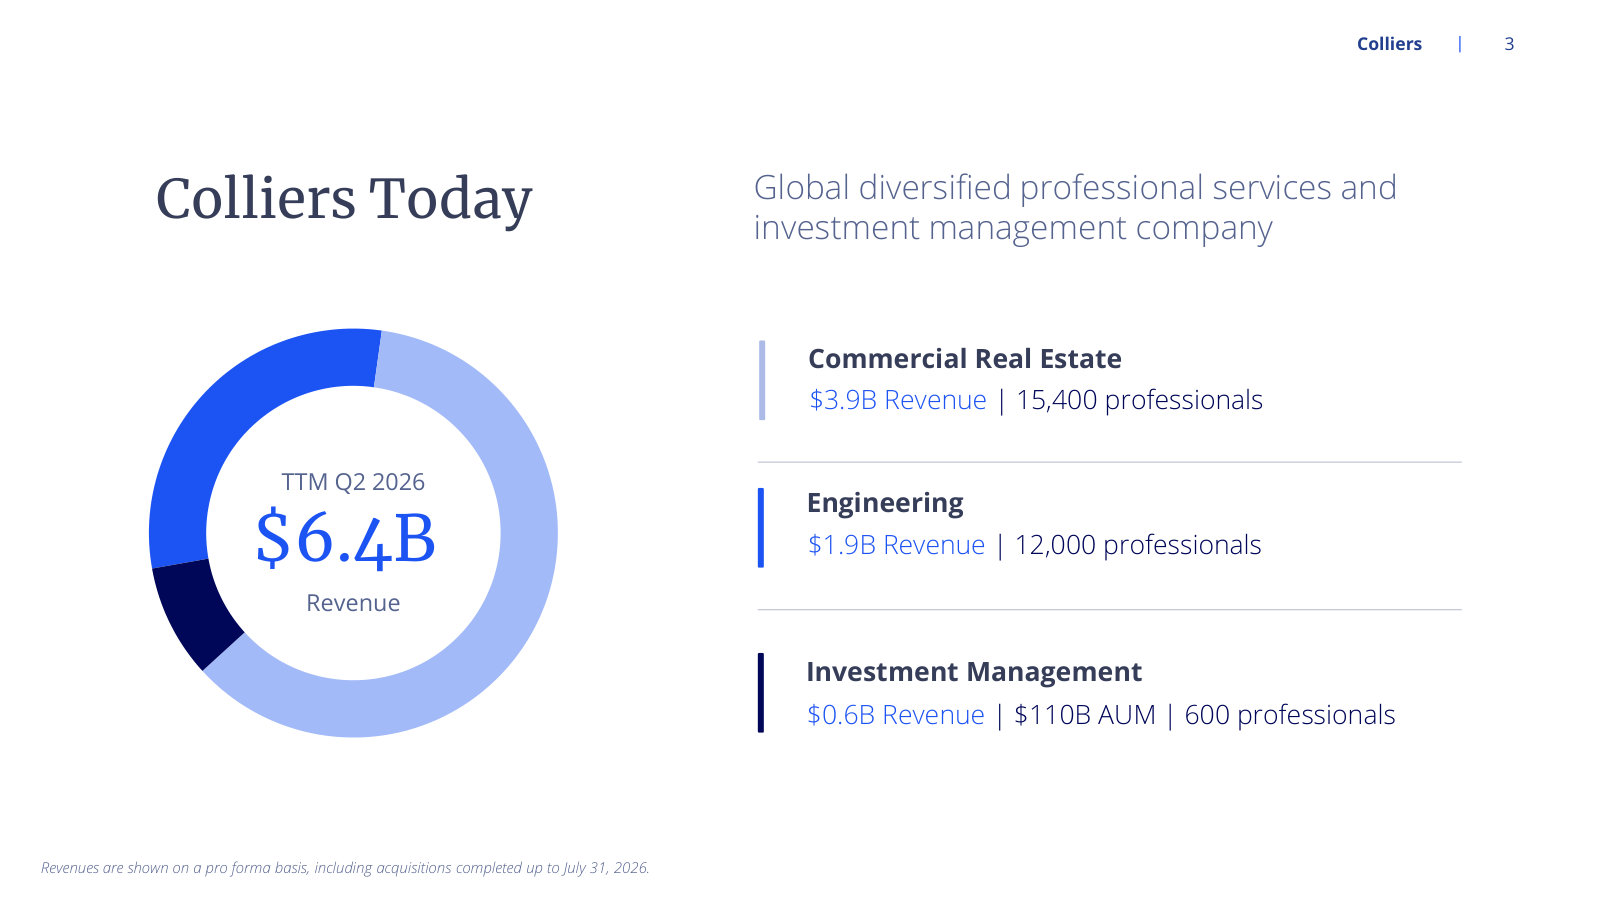
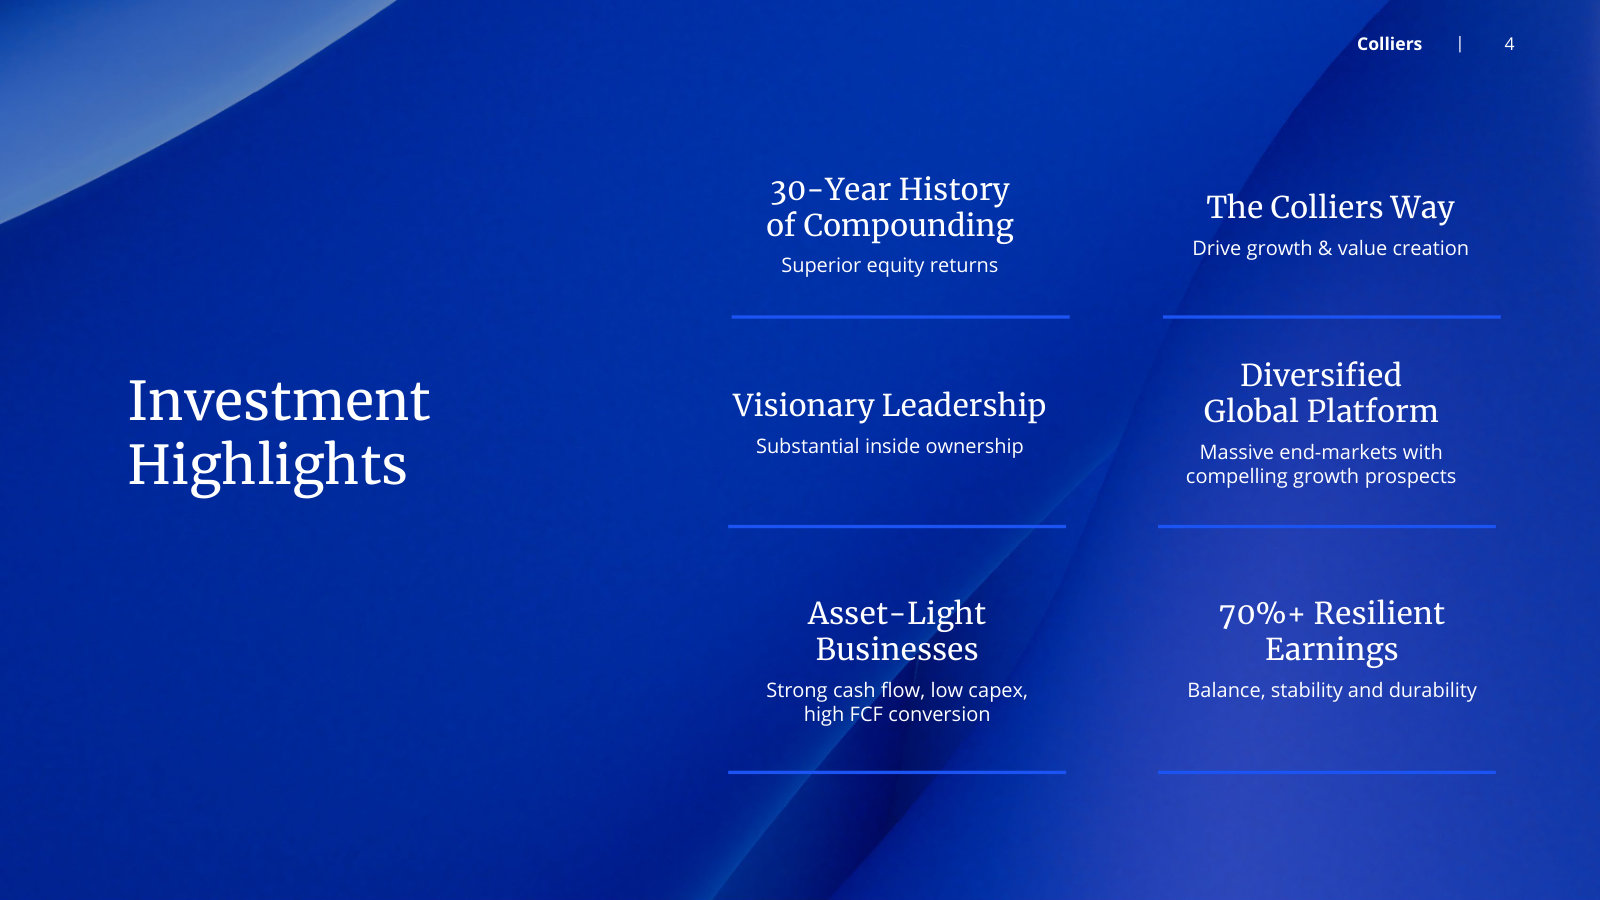
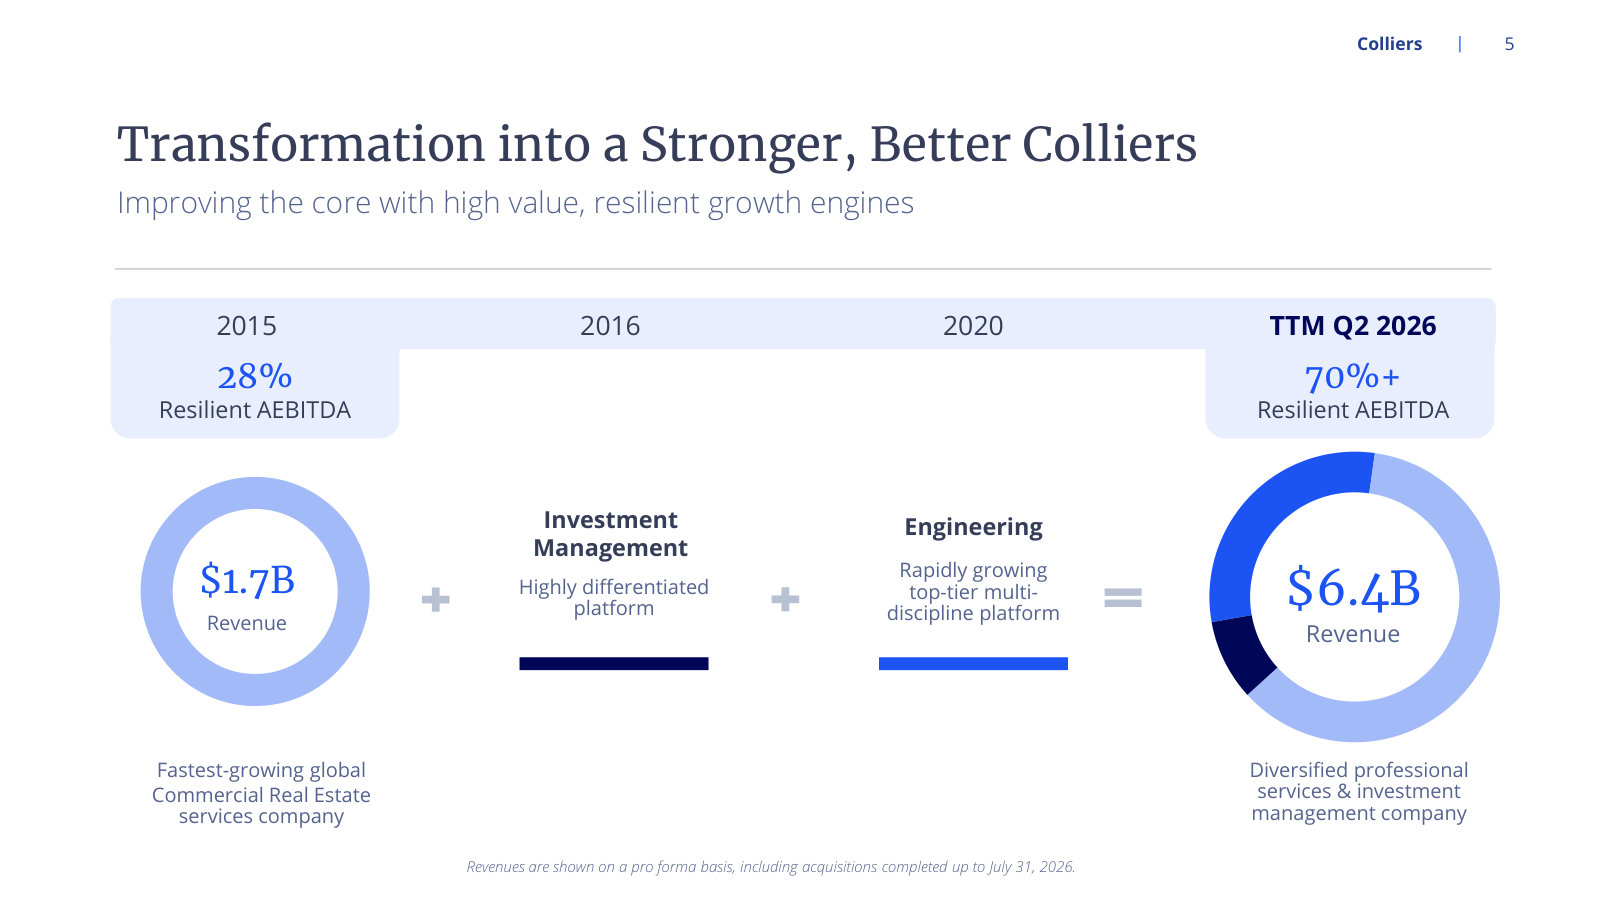
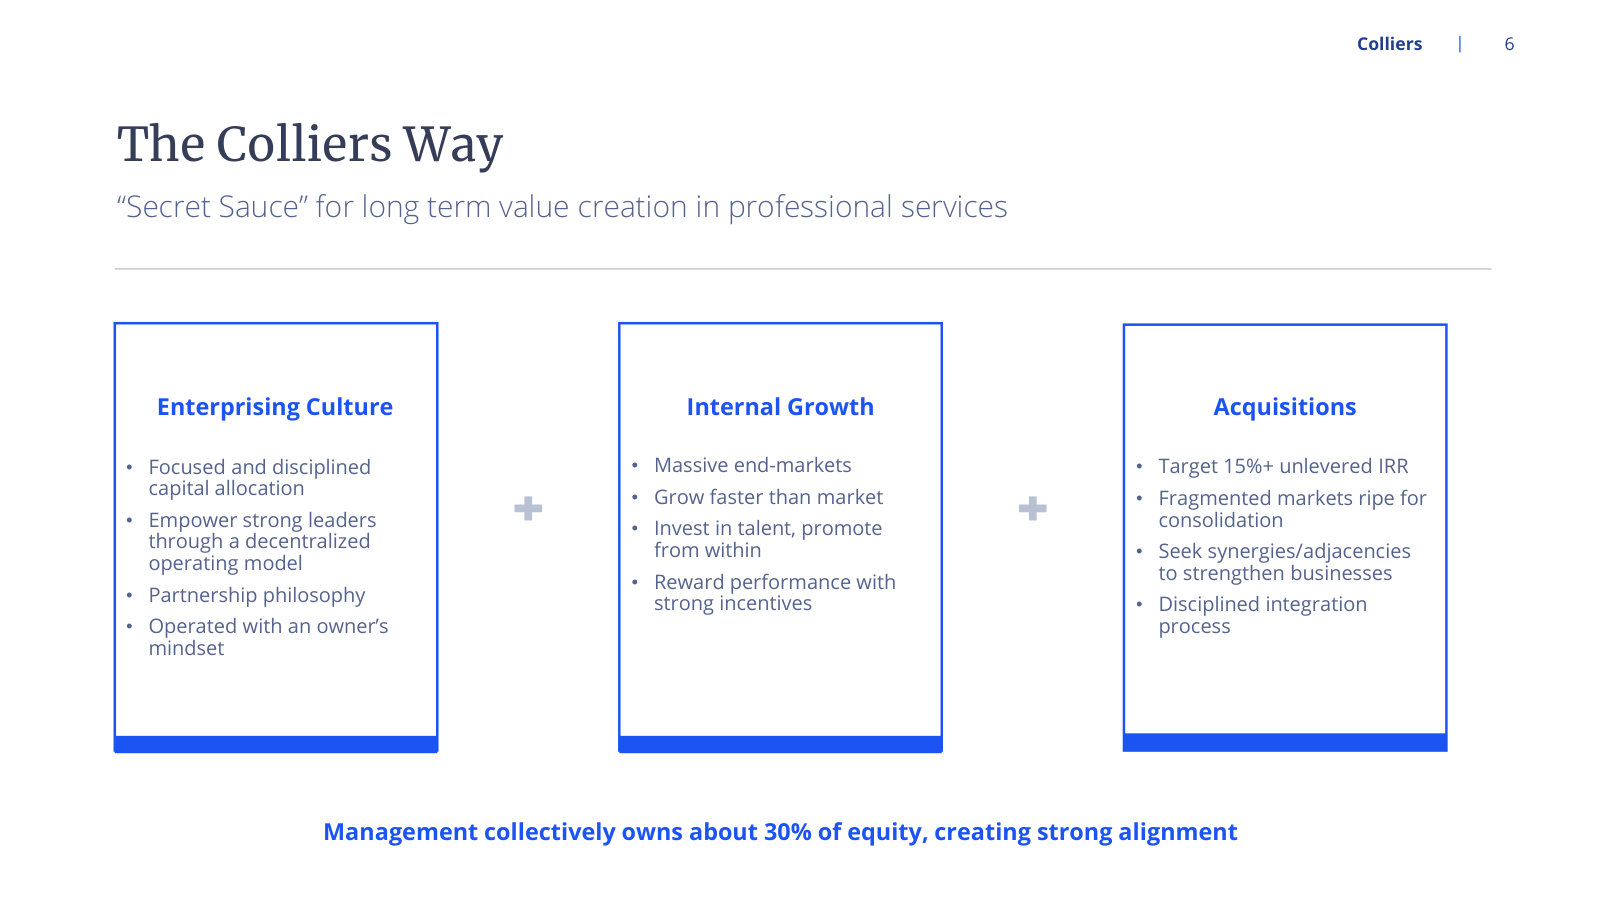
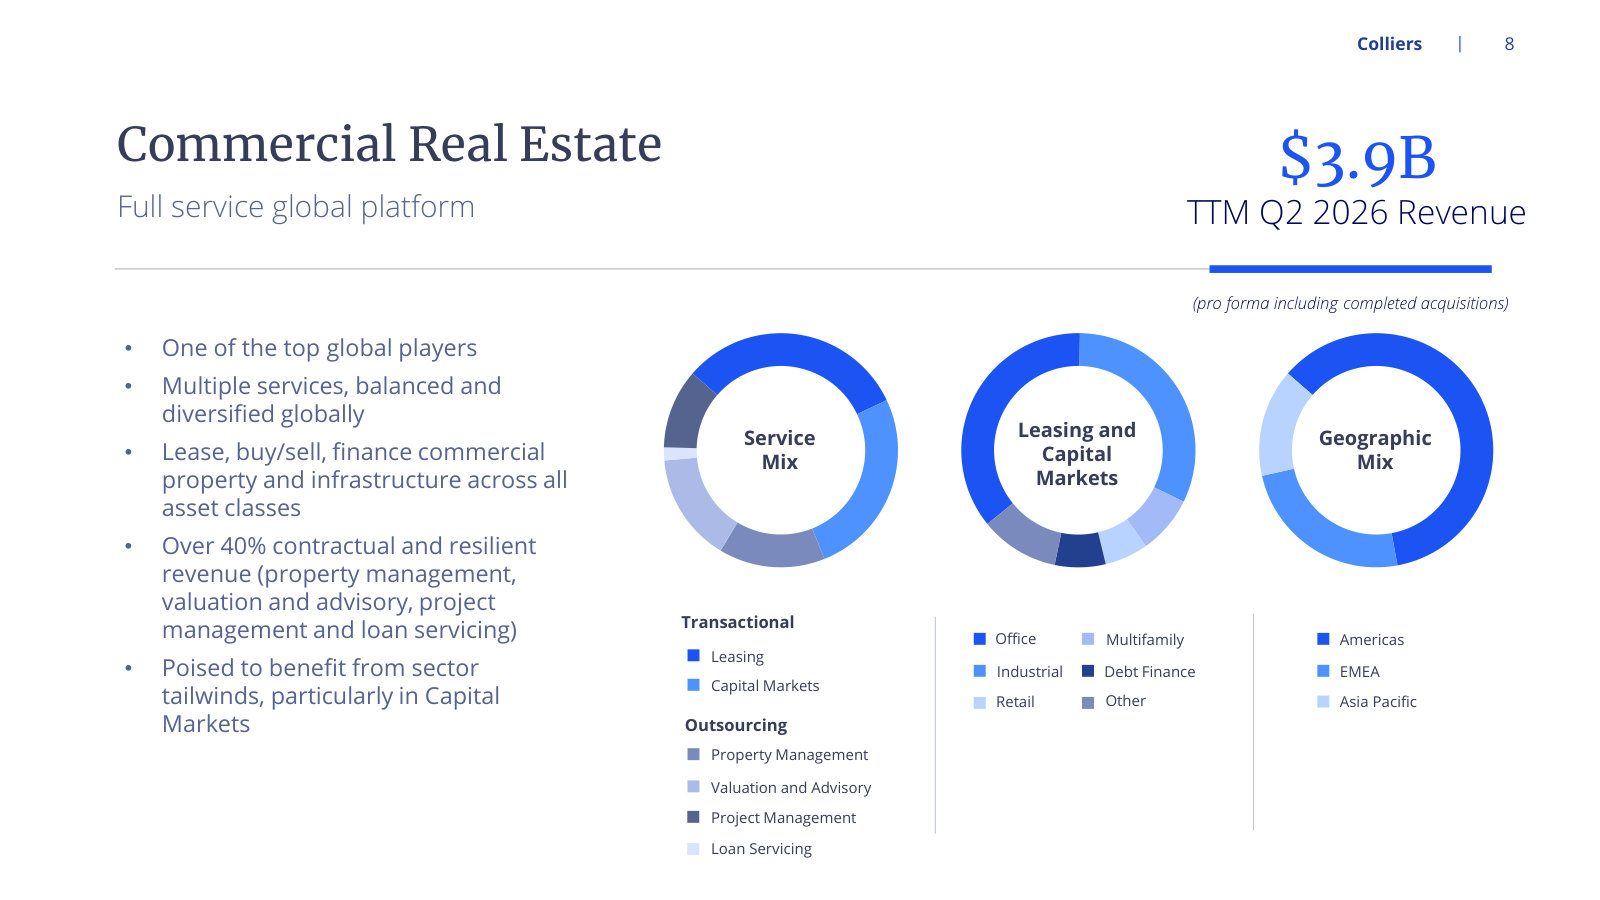
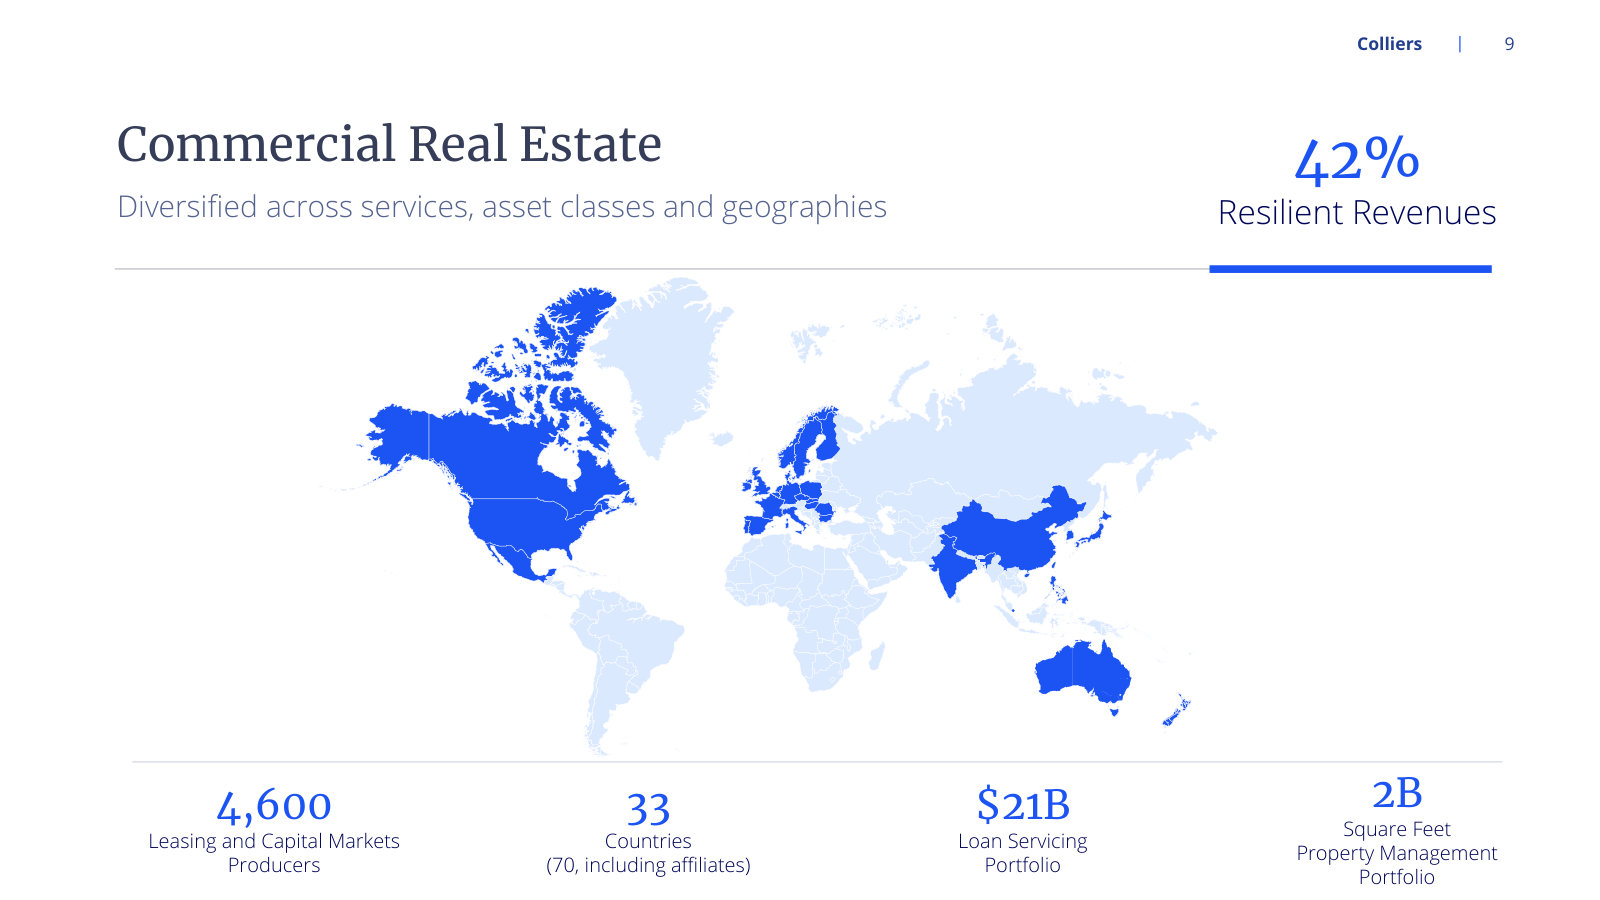
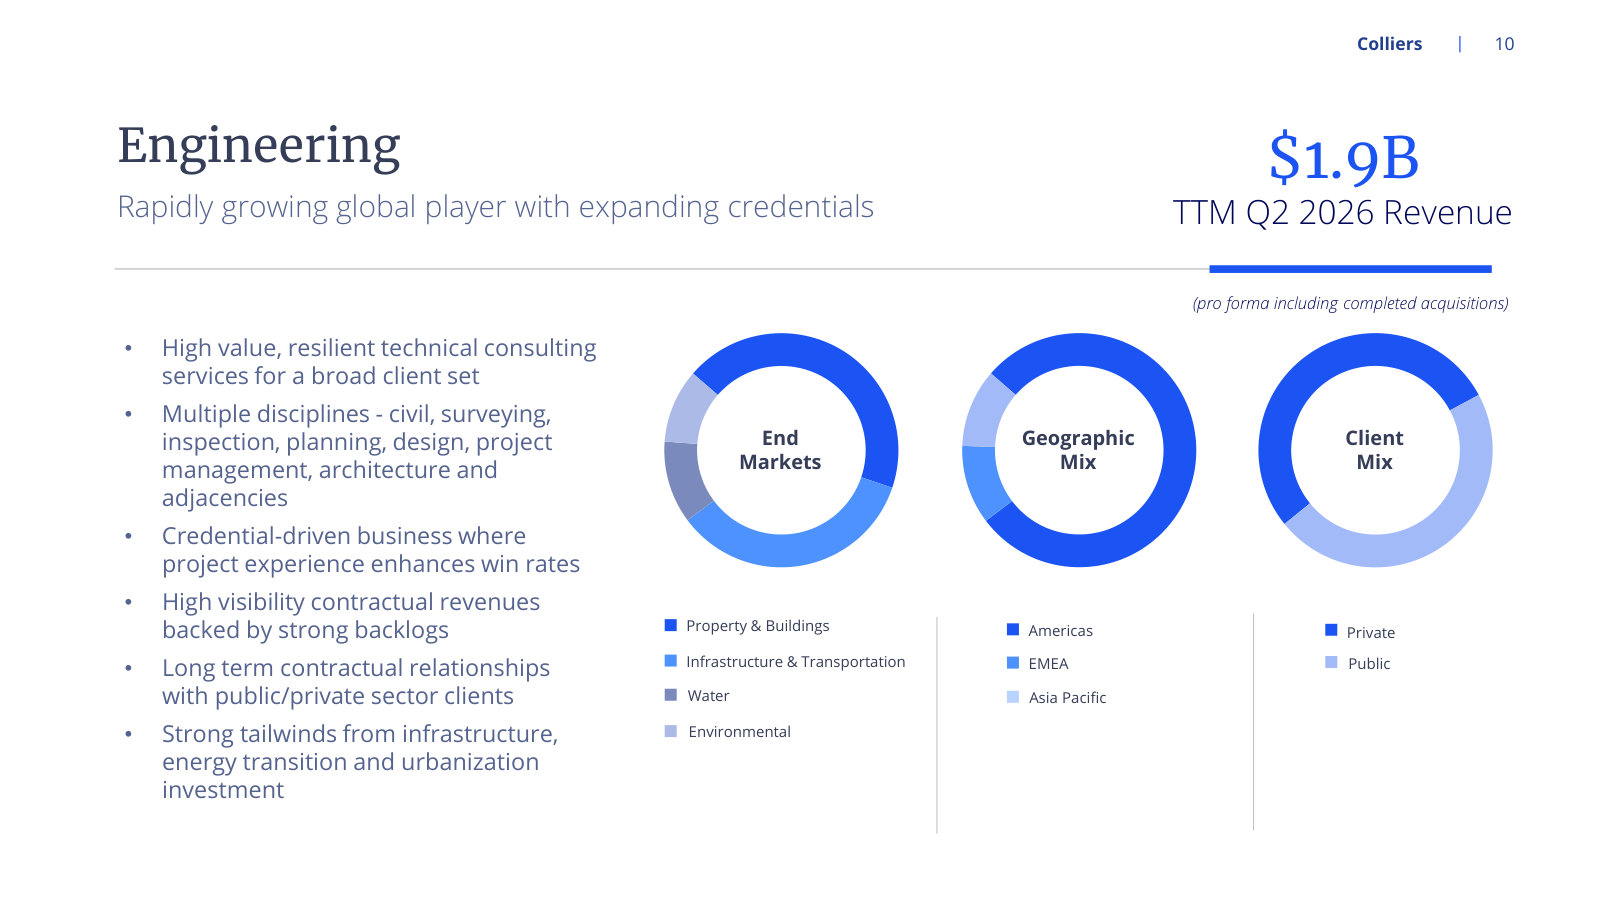
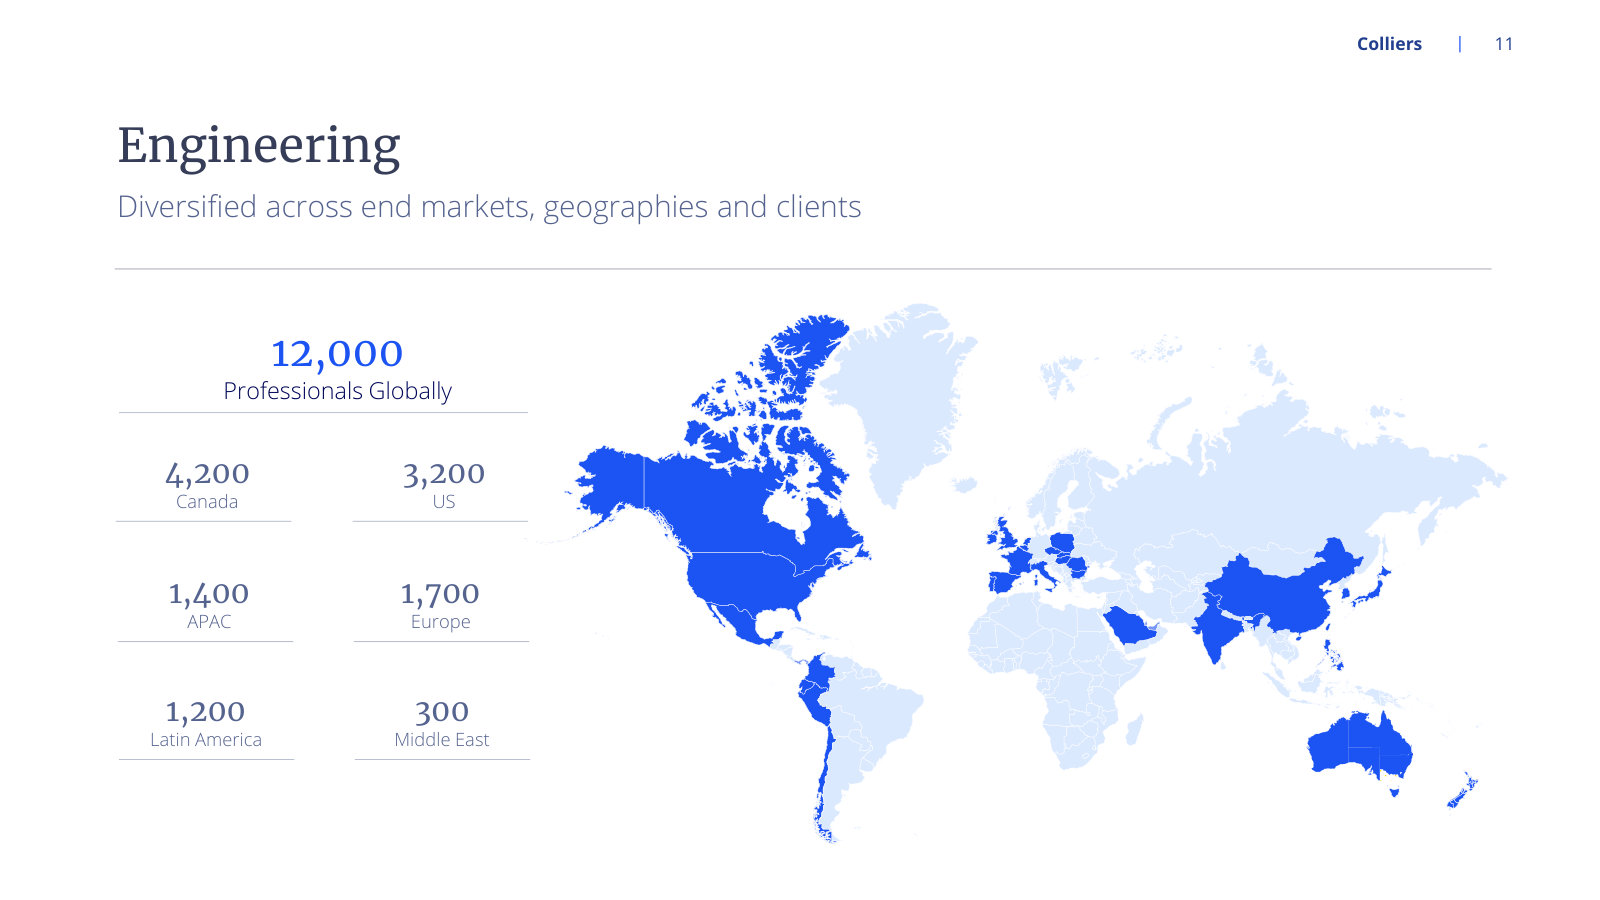
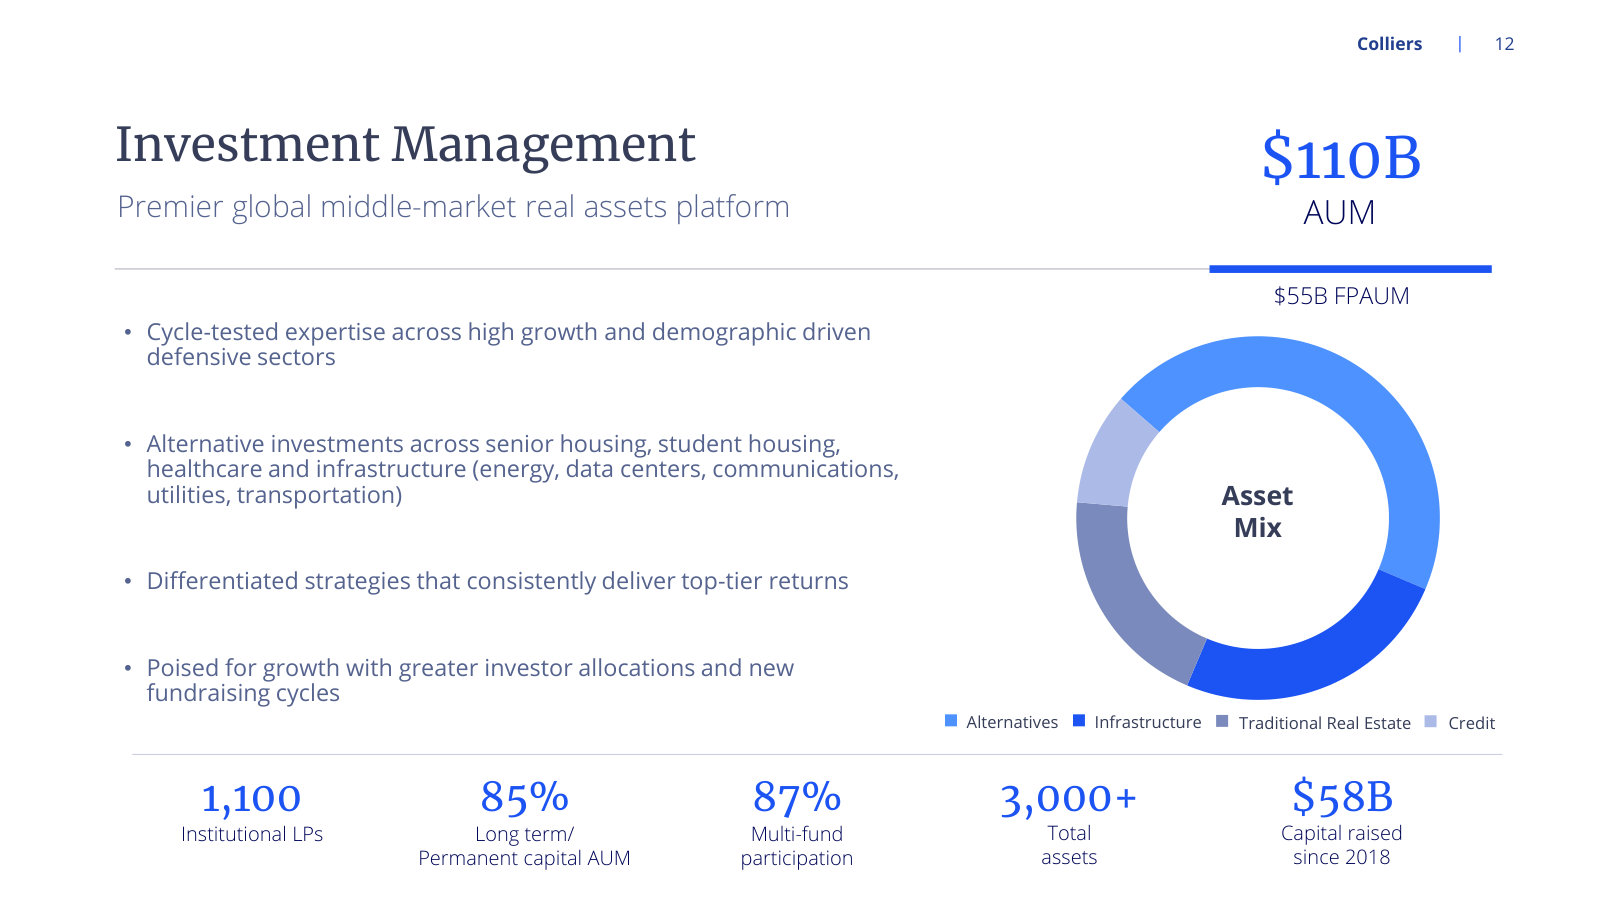
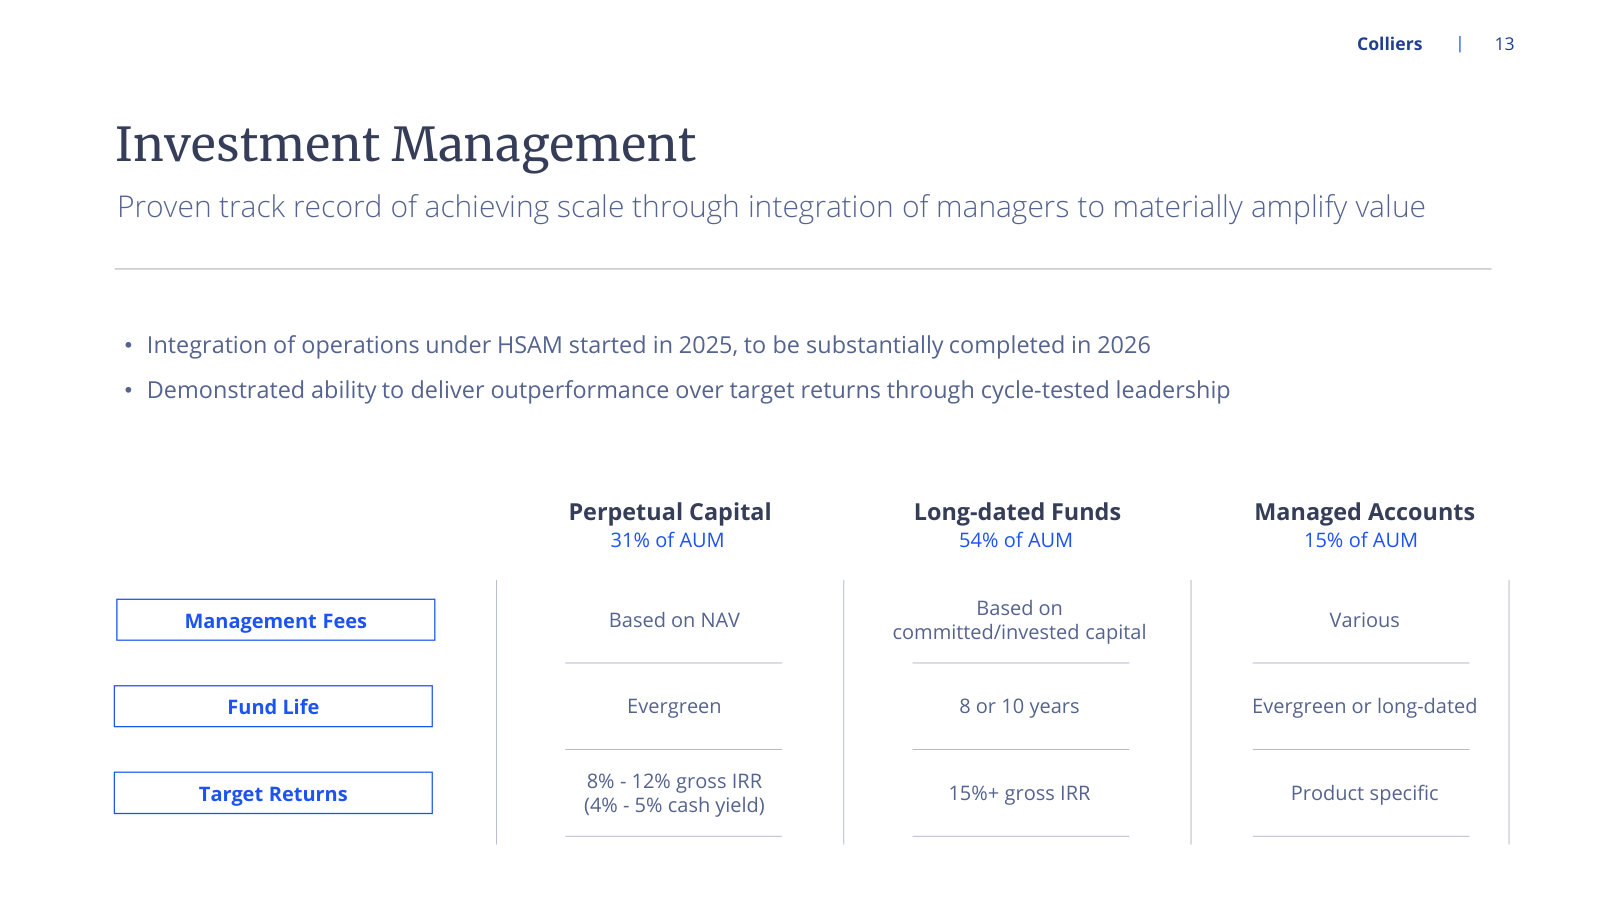
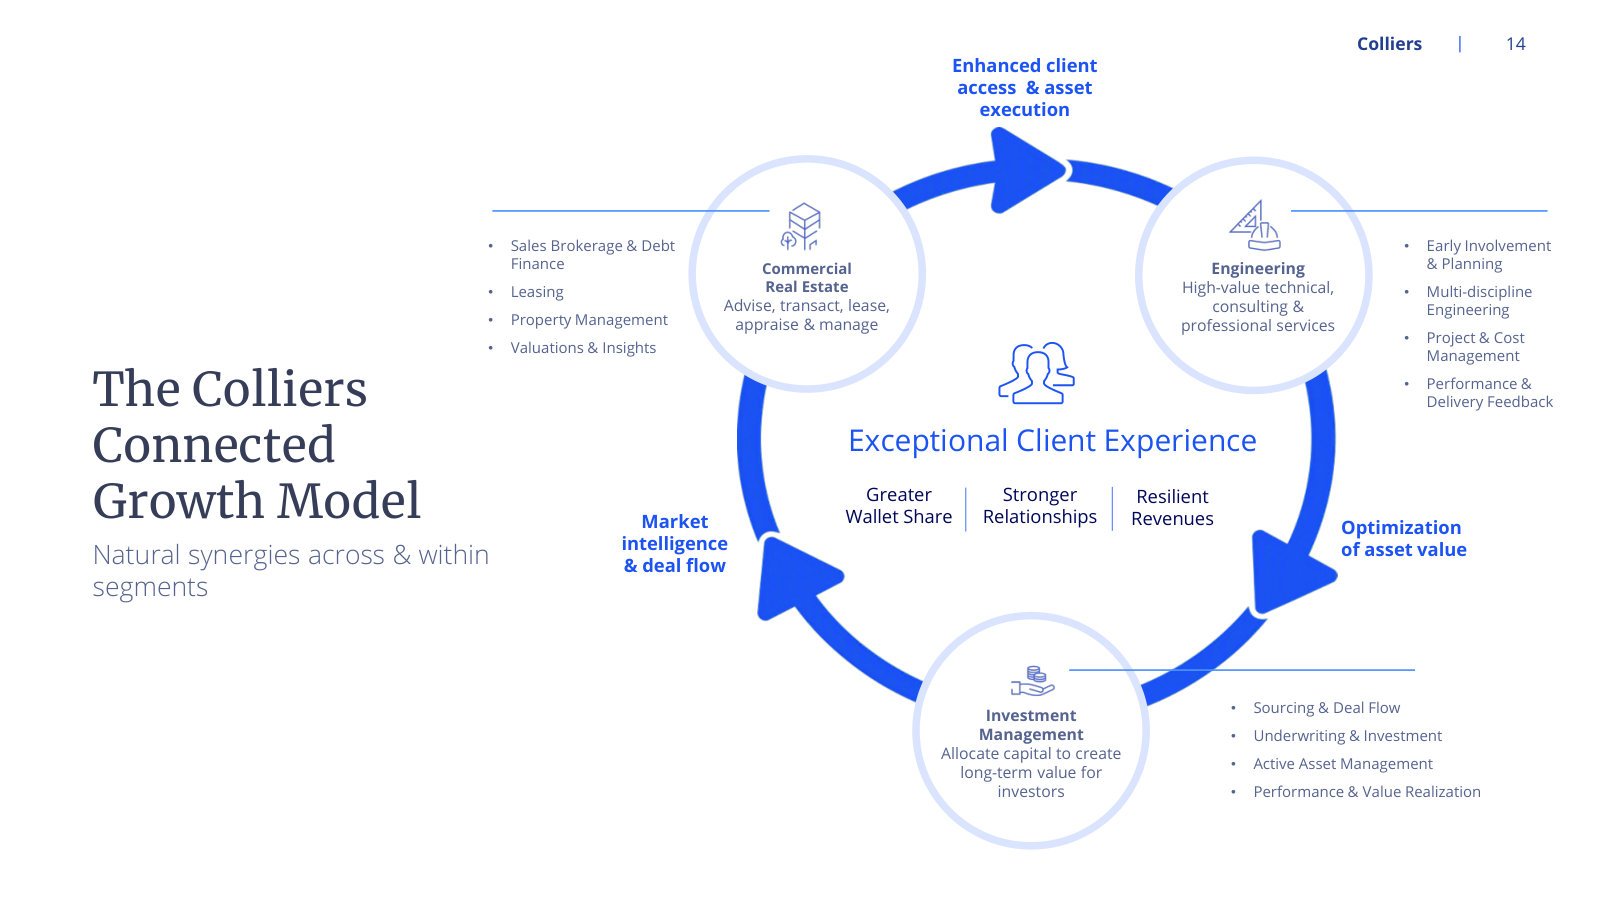
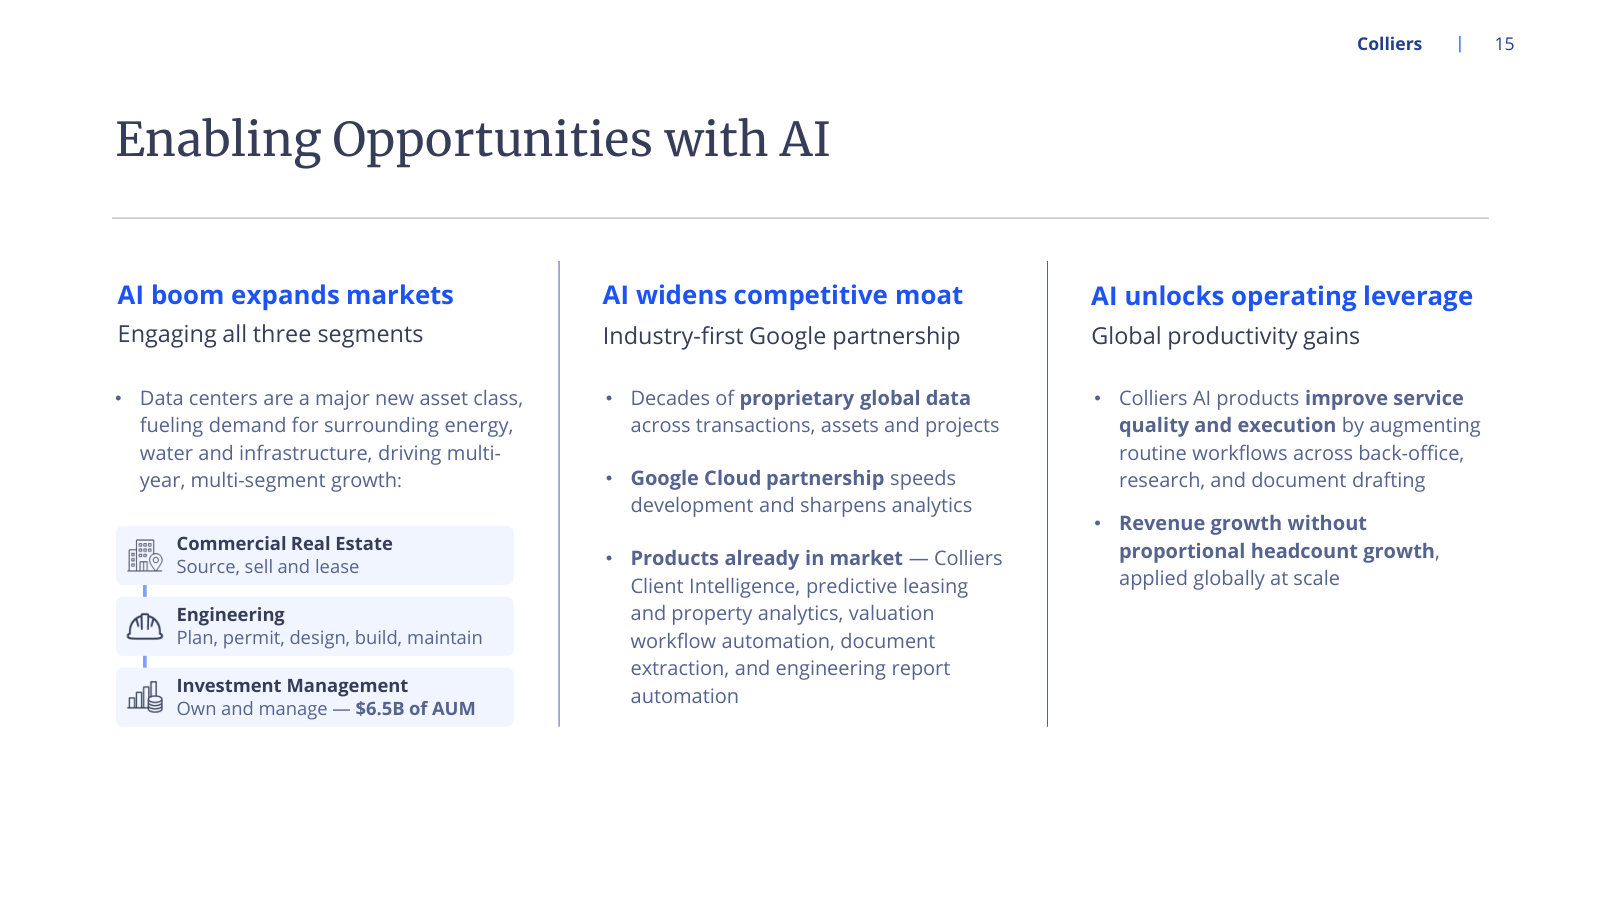
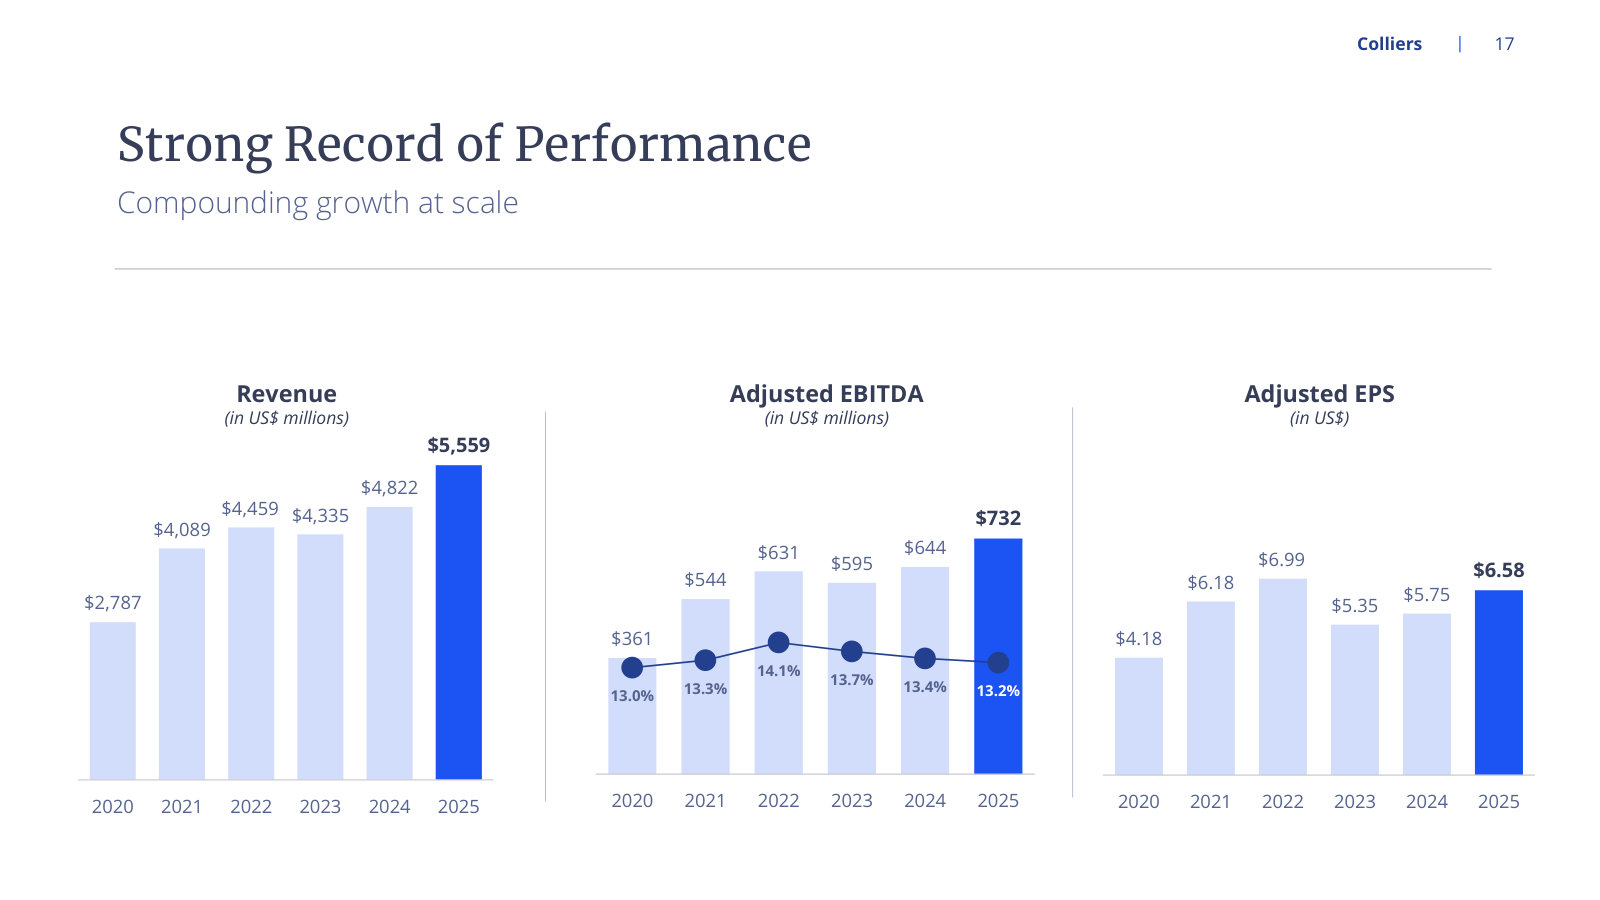
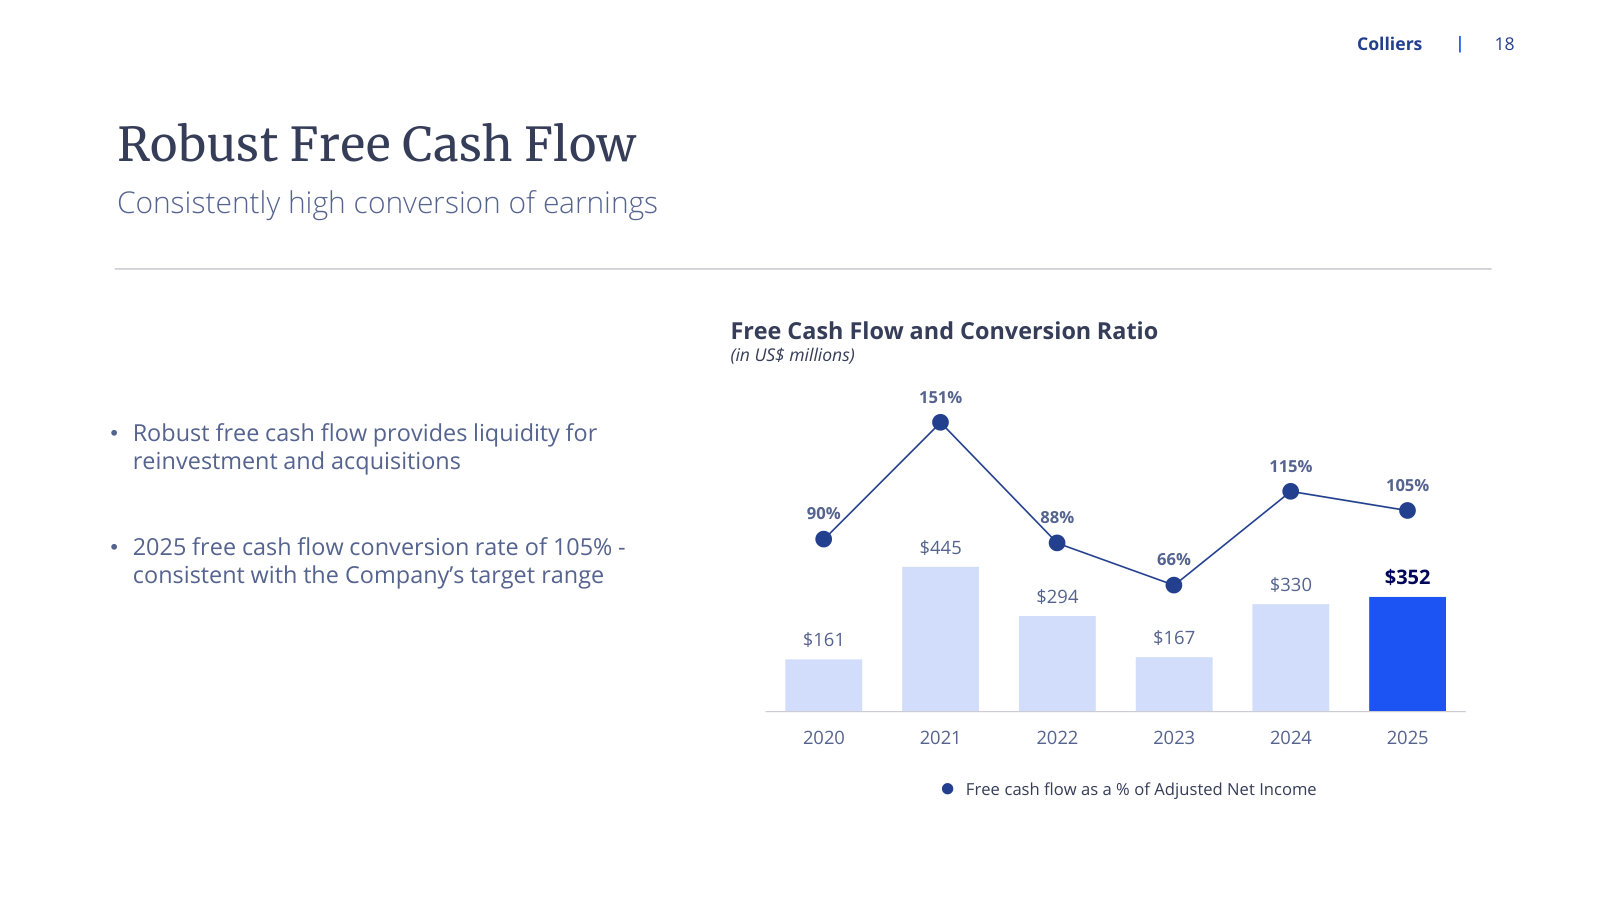
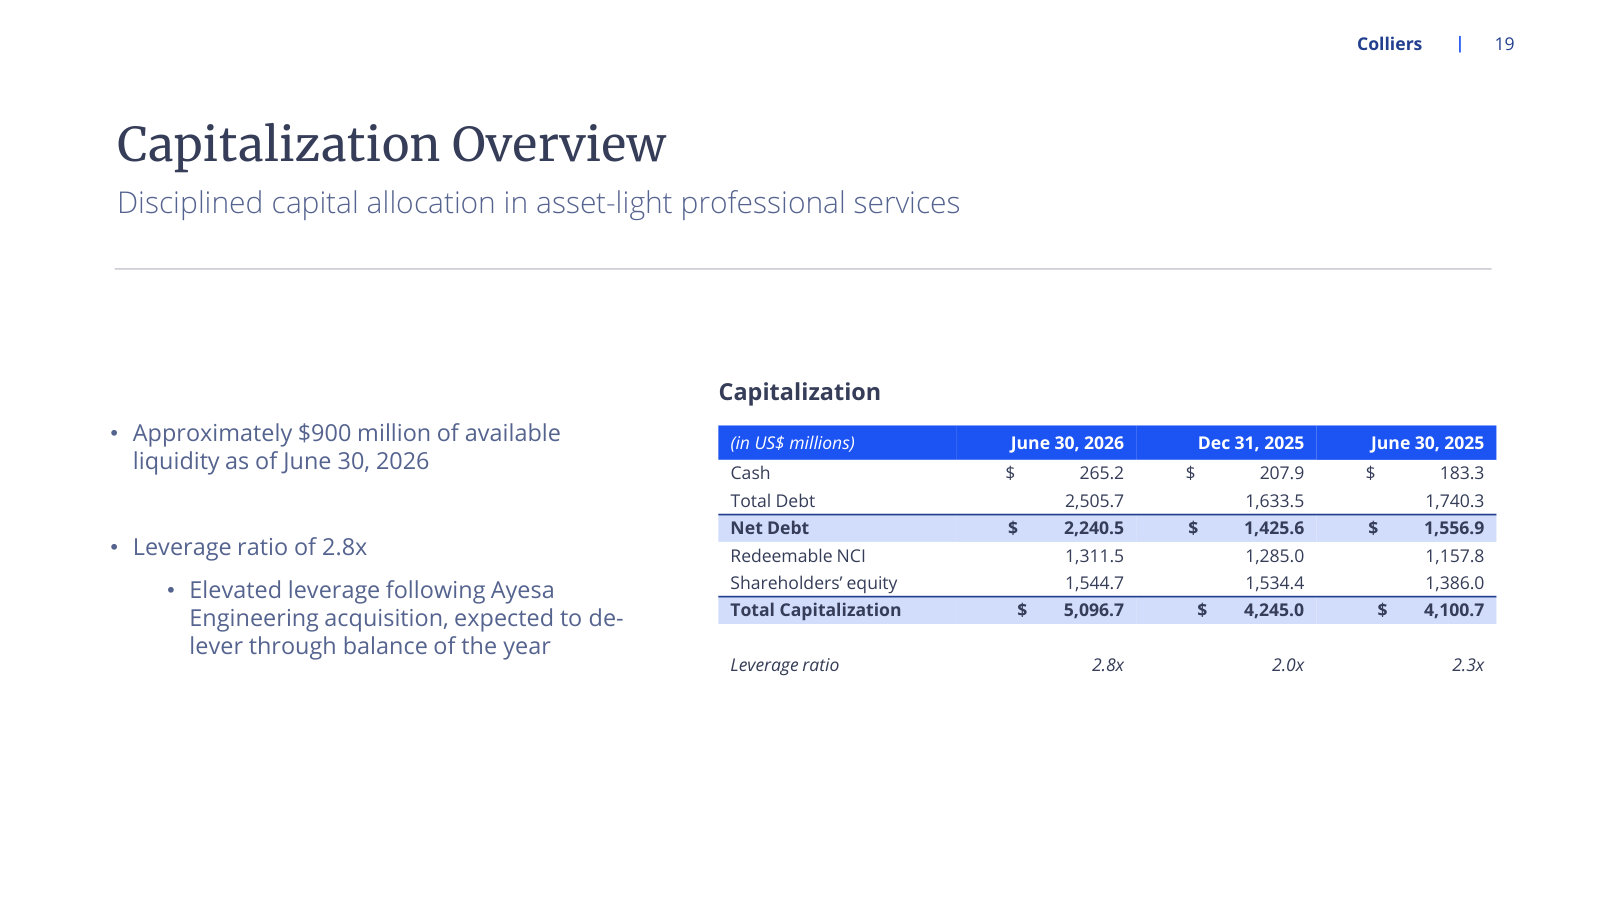
p. 3 — The whole company on one page: three segments sized by revenue, headcount and AUM against $6.4B of TTM revenue. · Open the full presentation →p. 4 — Management's own six-point case for the shares — the frame the rest of the deck sets out to support. · Open the full presentation →p. 5 — How the mix changed: $1.7B revenue and 28% resilient EBITDA in 2015 to $6.4B and 70%+ today. · Open the full presentation →p. 6 — The operating model — decentralised partnership culture, internal growth, and a 15%+ unlevered IRR acquisition hurdle. · Open the full presentation →p. 8 — What the largest segment sells: service, asset-class and geographic mix behind $3.9B of revenue. · Open the full presentation →p. 9 — The real estate footprint in numbers — 4,600 producers, 33 countries, $21B loan servicing, 2B sq ft managed. · Open the full presentation →p. 10 — Engineering's end markets, geography and public/private client split behind $1.9B of pro forma revenue. · Open the full presentation →p. 11 — Where the 12,000 engineering professionals actually sit — Canada and the US account for well over half. · Open the full presentation →p. 12 — The asset management arm: $110B AUM, $55B fee-paying, across alternatives, infrastructure, real estate and credit. · Open the full presentation →p. 13 — How the fees work — fee basis, fund life and target returns for perpetual, long-dated and managed-account capital. · Open the full presentation →p. 14 — The flywheel argument: how the three segments are meant to feed each other deal flow, client access and execution. · Open the full presentation →p. 15 — Management's AI framing — data-centre demand across all three segments, a Google Cloud partnership, productivity gains. · Open the full presentation →p. 17 — Six years of revenue, adjusted EBITDA and adjusted EPS, with EBITDA margin sitting near 13% throughout. · Open the full presentation →p. 18 — Free cash flow and conversion since 2020 — the asset-light claim measured against actual cash. · Open the full presentation →p. 19 — The balance sheet after Ayesa: 2.8x leverage, roughly $900M of liquidity, and a stated de-levering path. · Open the full presentation →
The latest quarterly deck: current run-rate by segment, the post-Ayesa balance sheet, and 2026 guidance reaffirmed. · Open the full document →
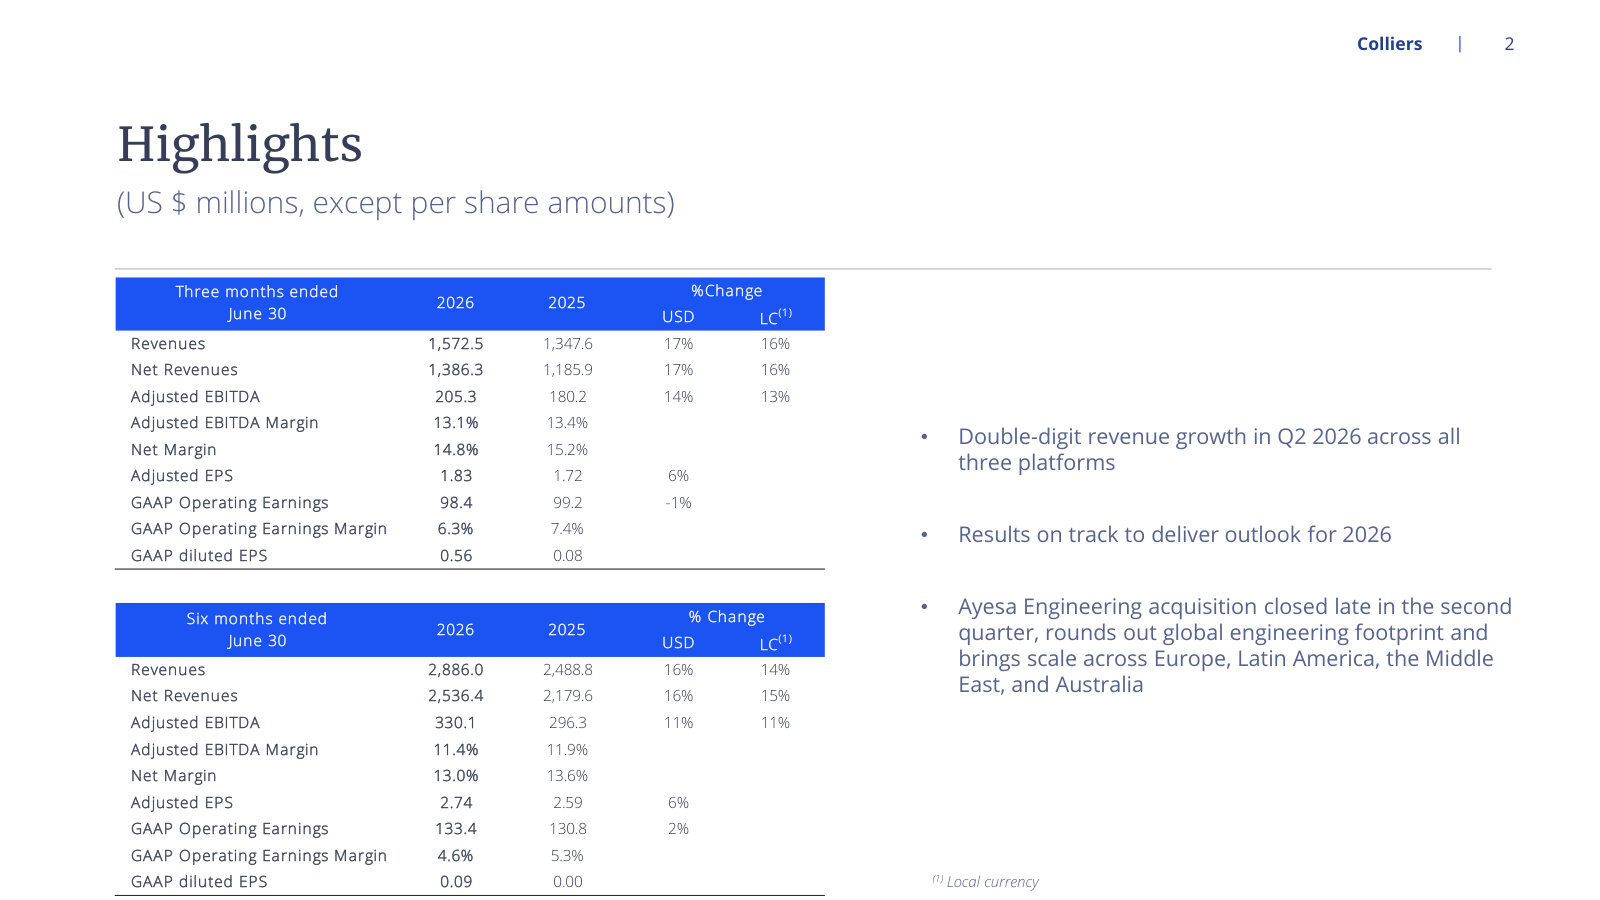
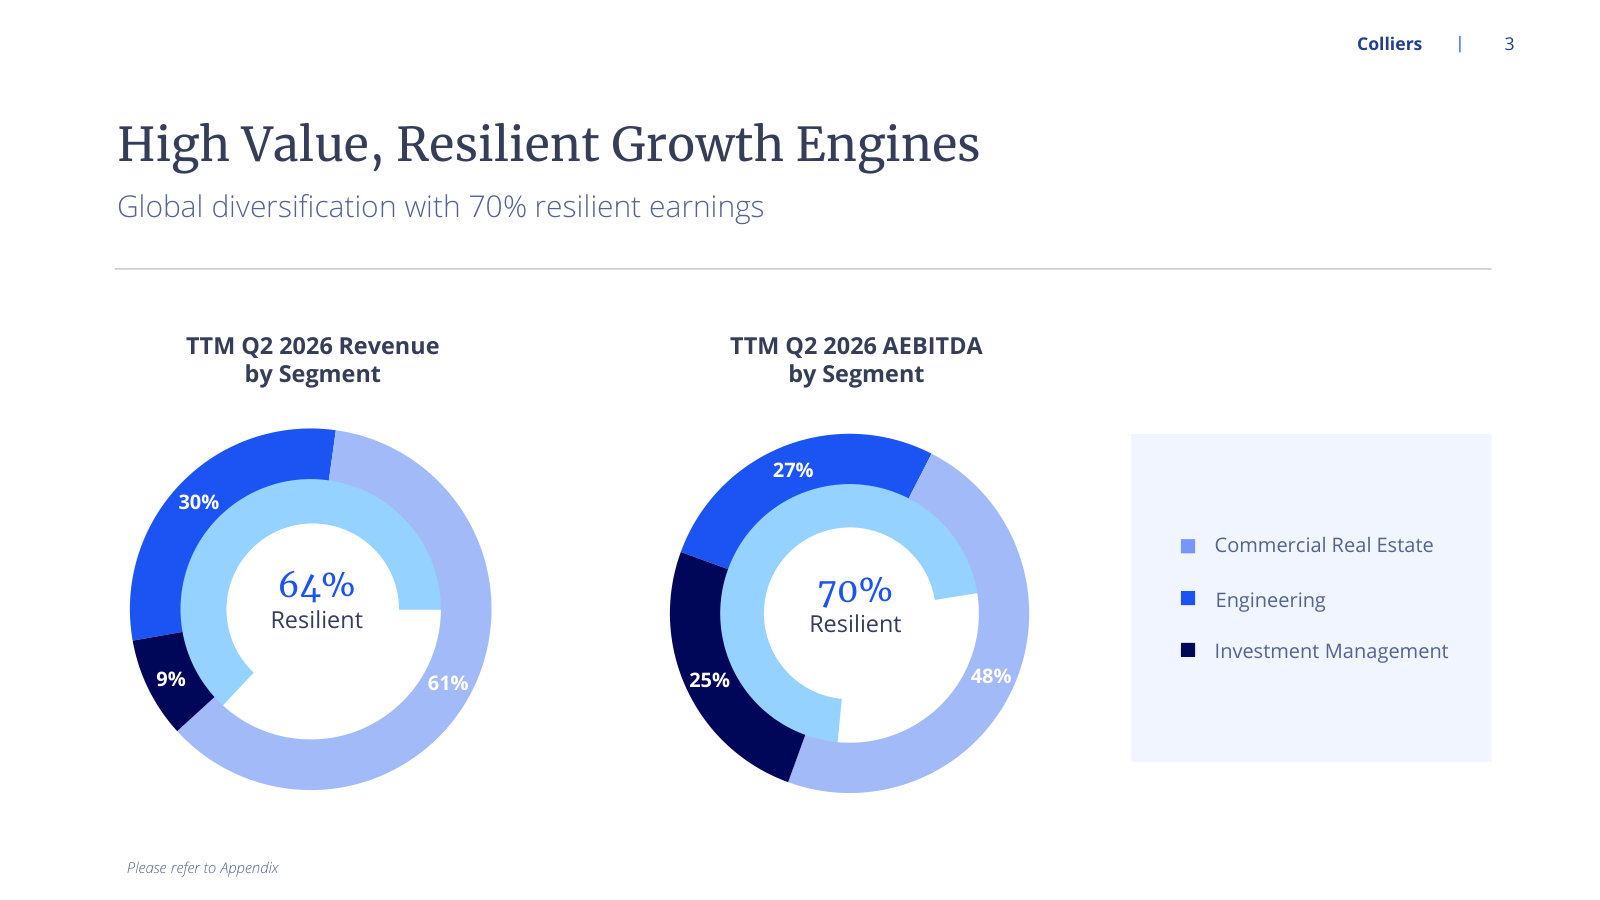
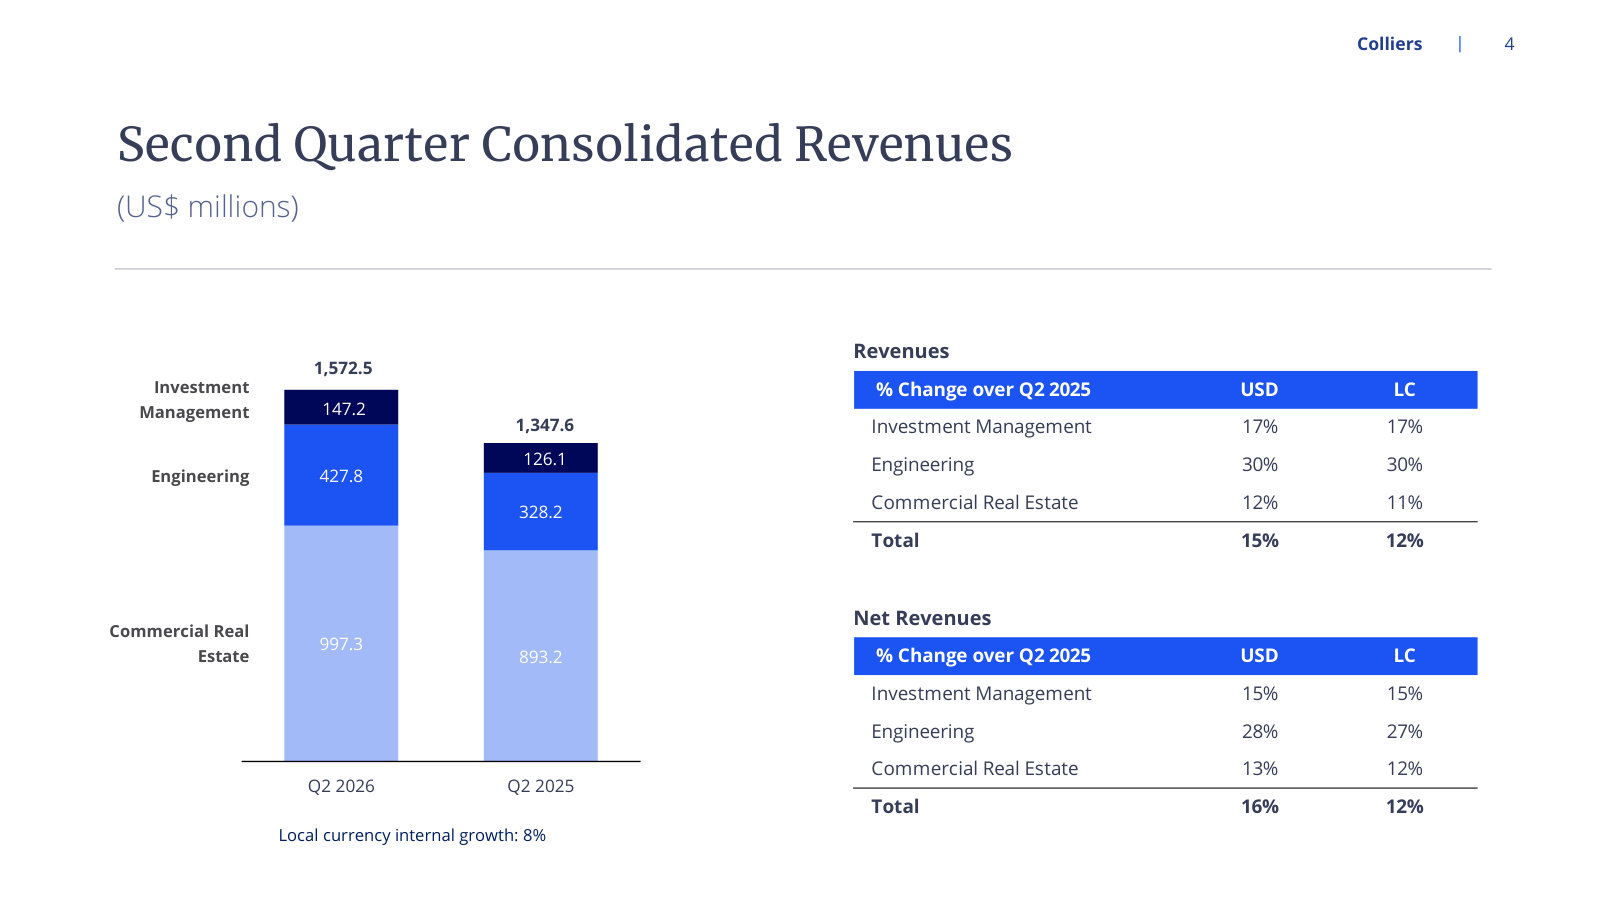
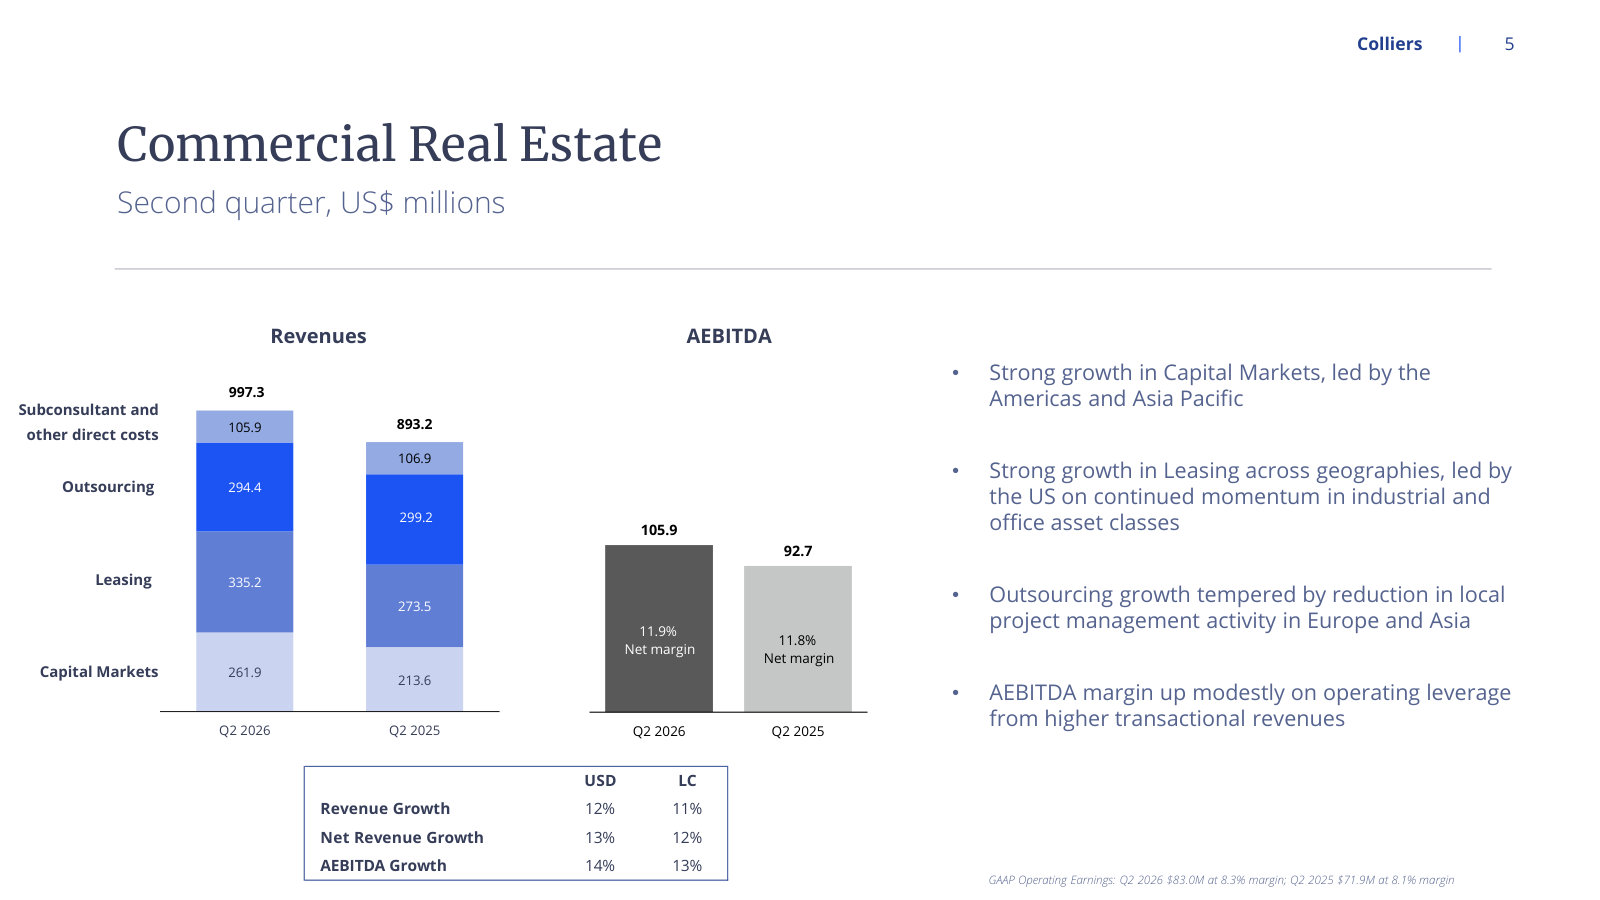
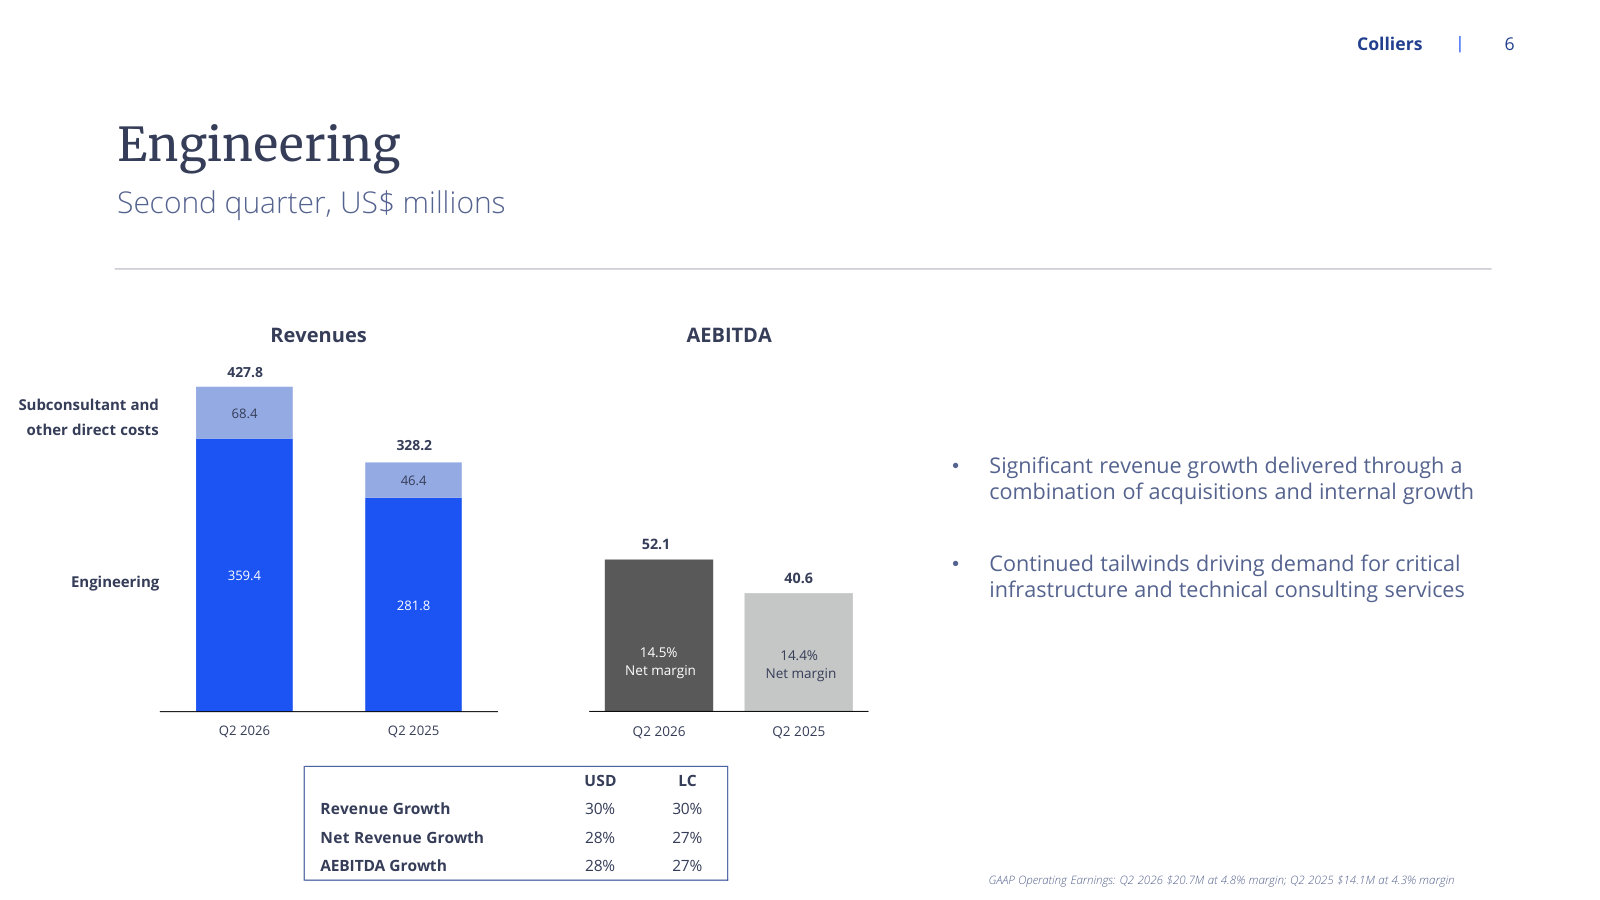
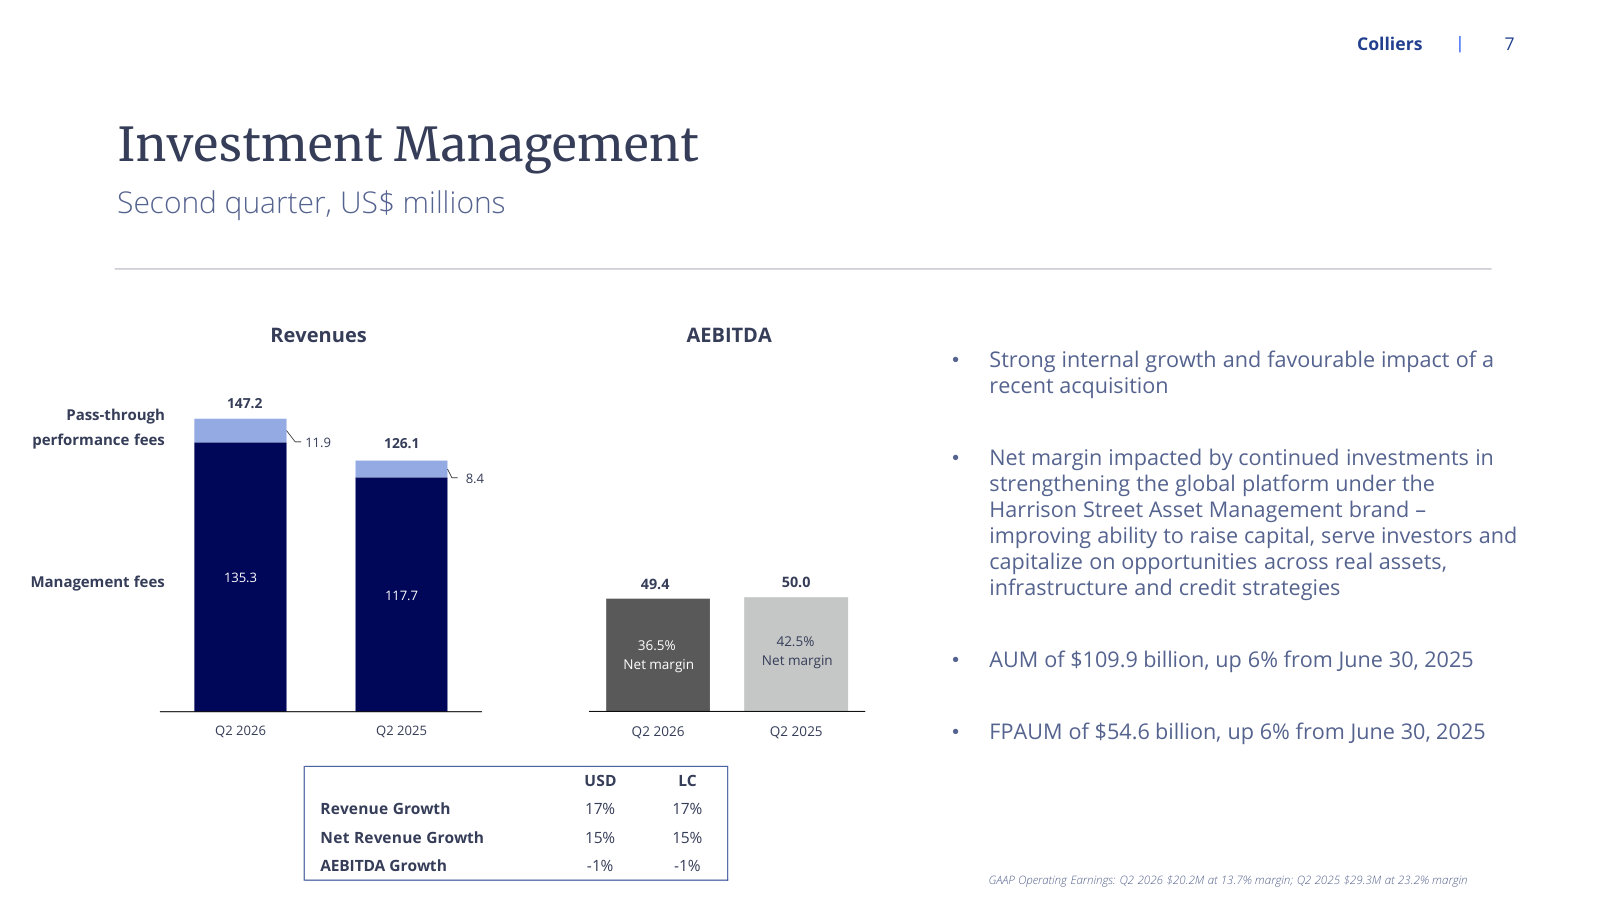
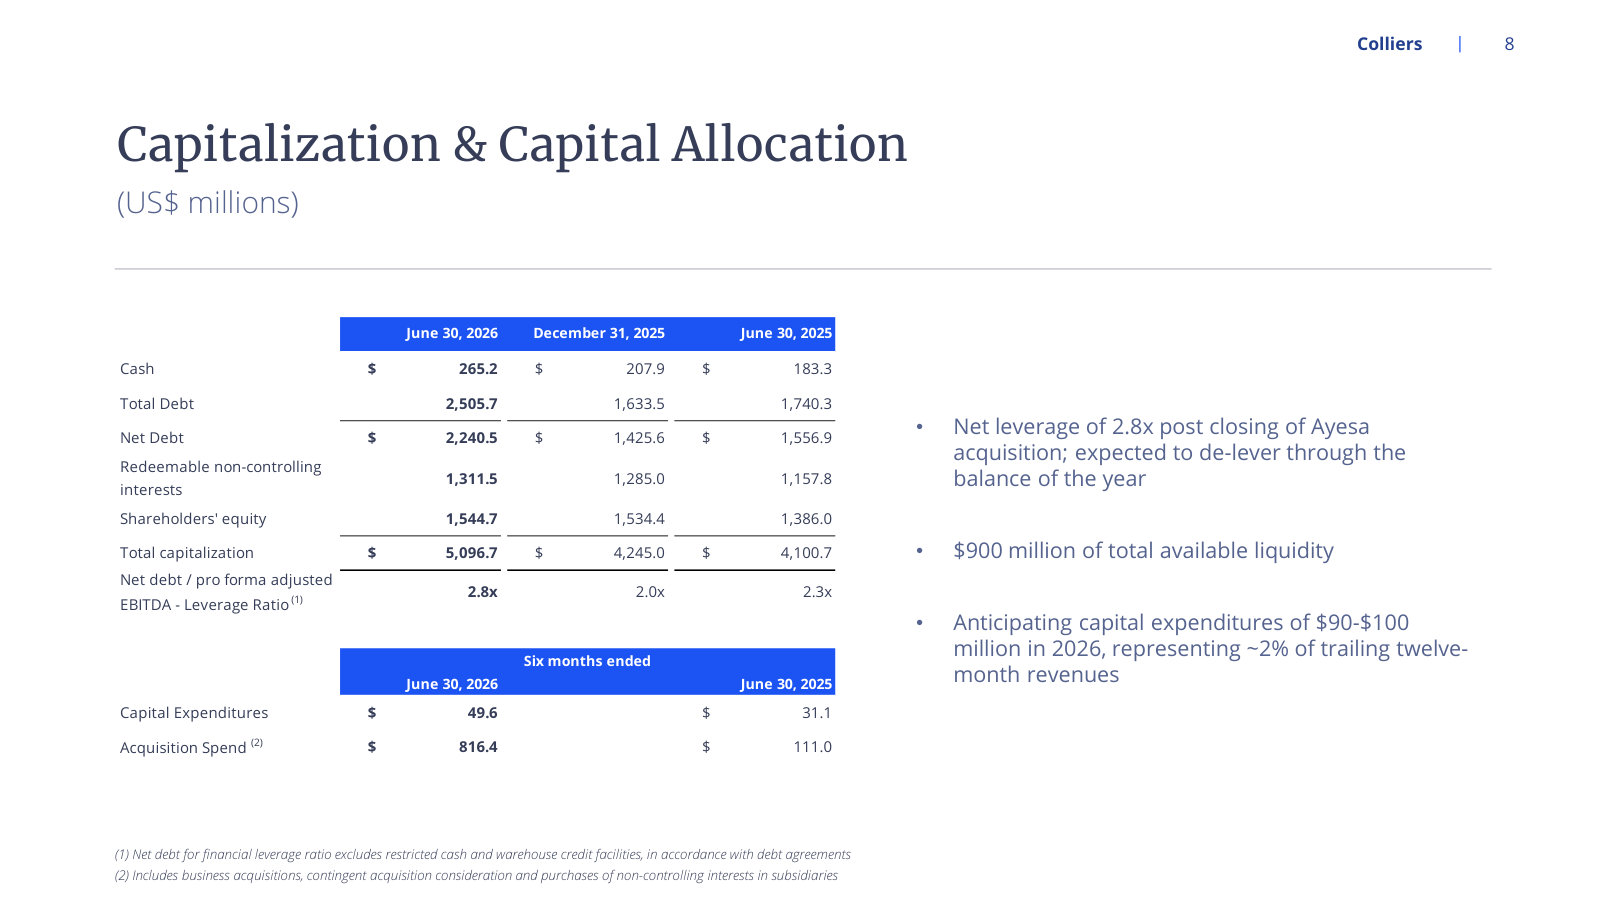
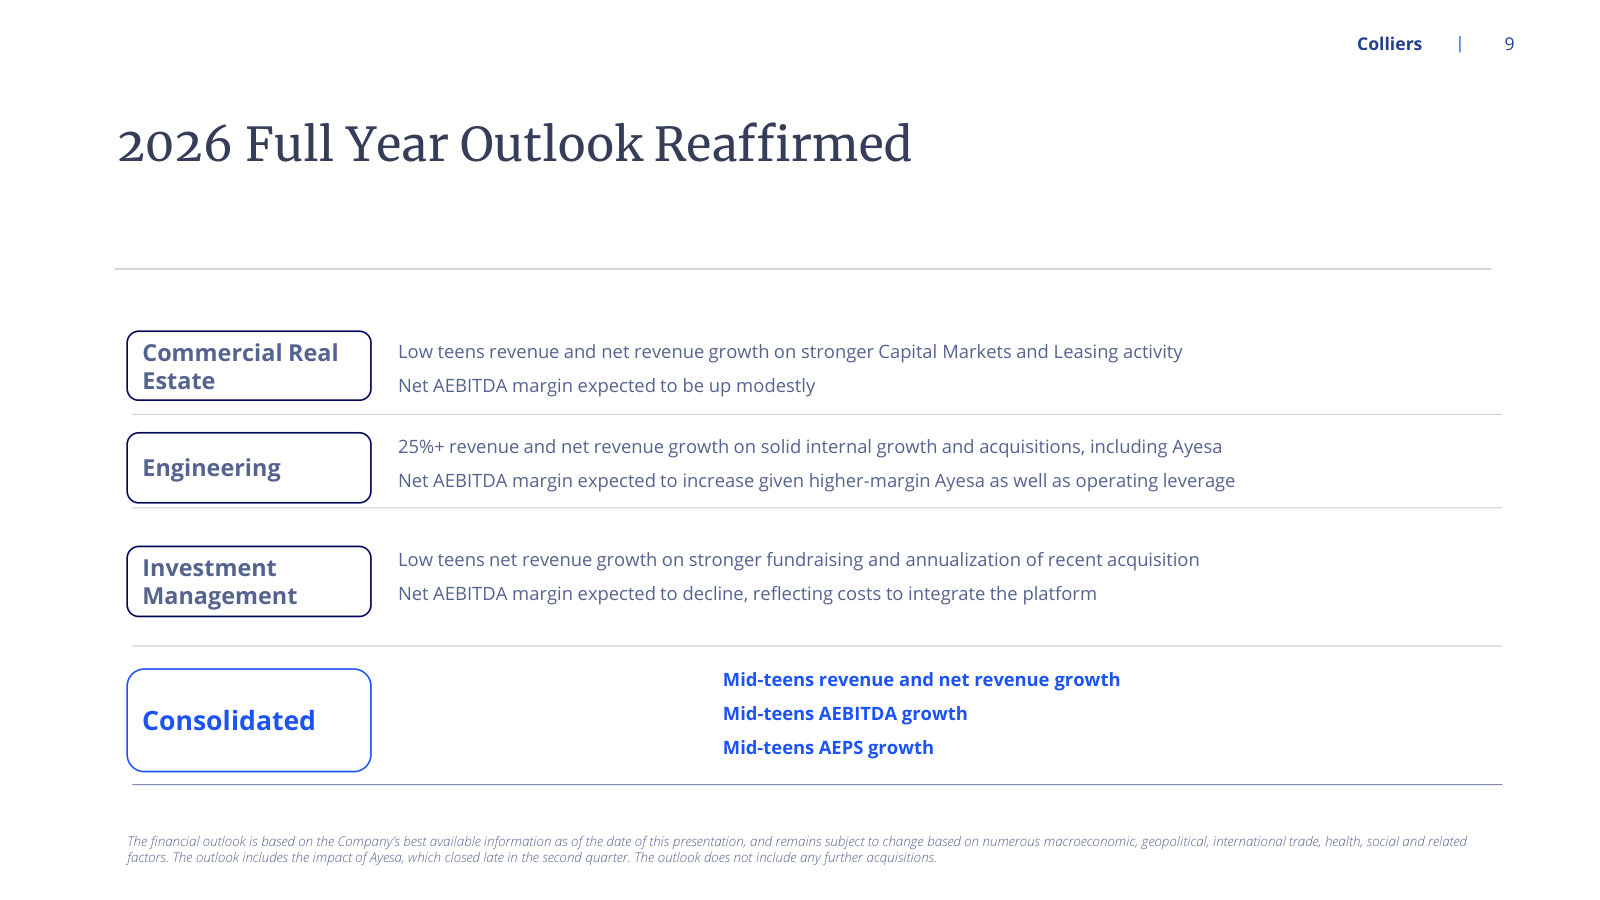
p. 2 — Quarter and first-half results in one table — revenue, adjusted EBITDA, margins and EPS against the prior year. · Open the full presentation →p. 3 — The resilience claim quantified: 64% of TTM revenue and 70% of adjusted EBITDA from recurring services. · Open the full presentation →p. 4 — Where 15% revenue growth came from by segment, and how much of it survives in local currency. · Open the full presentation →p. 5 — Real estate revenue split by service line with margins — Capital Markets and Leasing carried the quarter. · Open the full presentation →p. 6 — Engineering's 30% growth and 14.5% net margin, split between acquisitions and internal growth. · Open the full presentation →p. 7 — Management fees versus pass-through performance fees, and why net margin fell to 36.5% on integration costs. · Open the full presentation →p. 8 — Leverage, liquidity, capex and acquisition spend — $816M deployed in the first half, mostly Ayesa. · Open the full presentation →p. 9 — The 2026 guidance management is now measured against, by segment and consolidated. · Open the full presentation →
The FY2025 wrap: full-year segment economics, plus the Ayesa acquisition that reshapes the Engineering segment. · Open the full document →
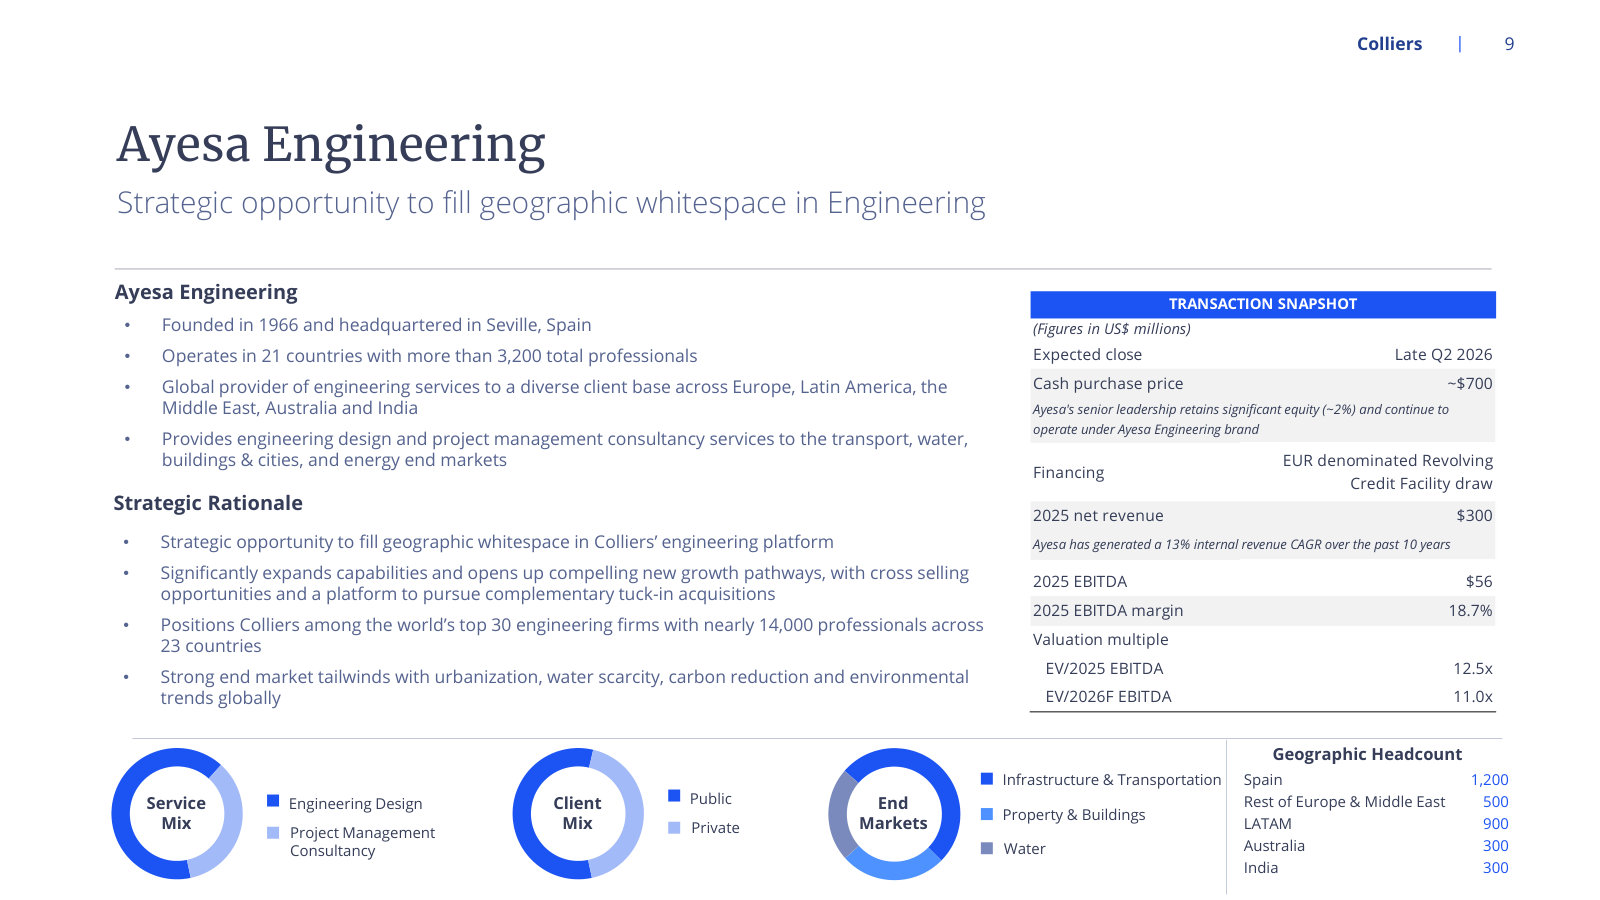
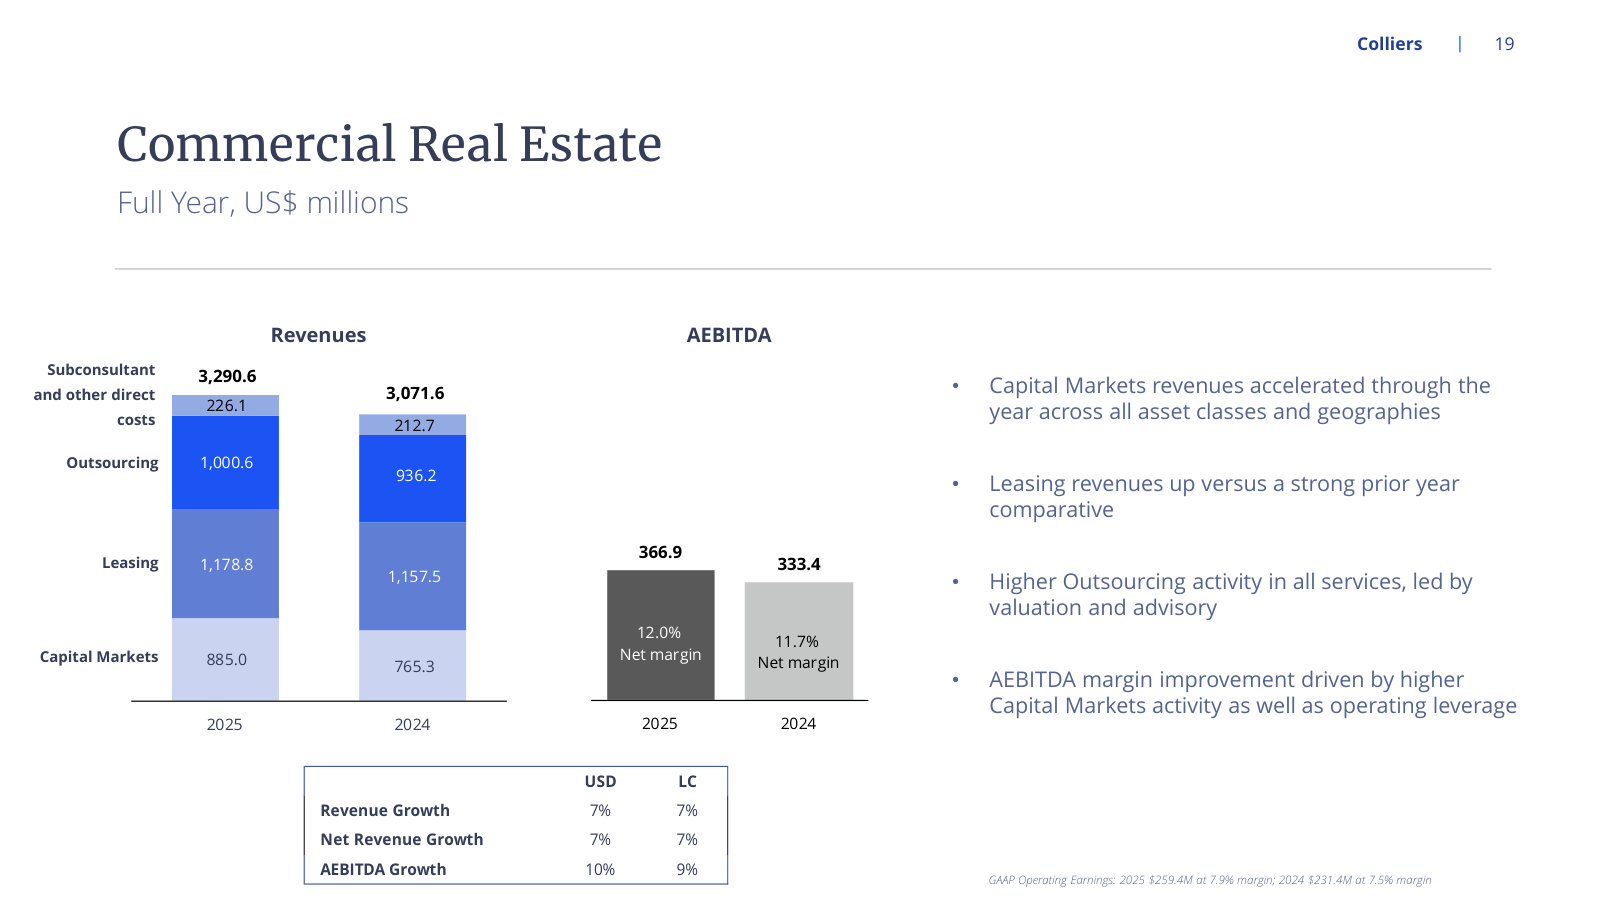
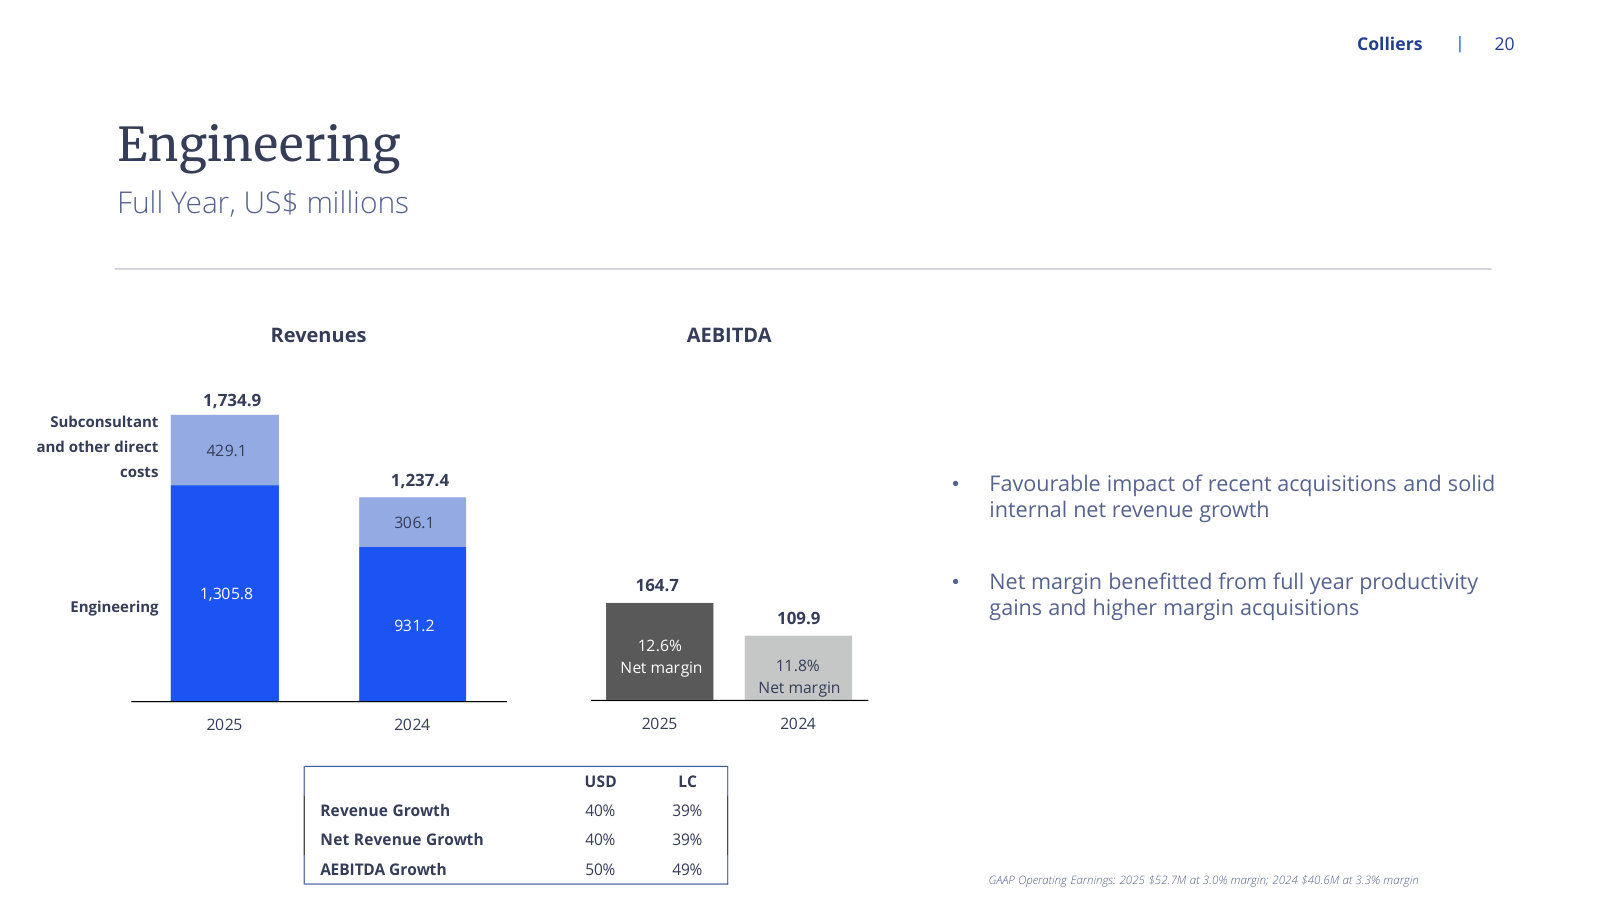
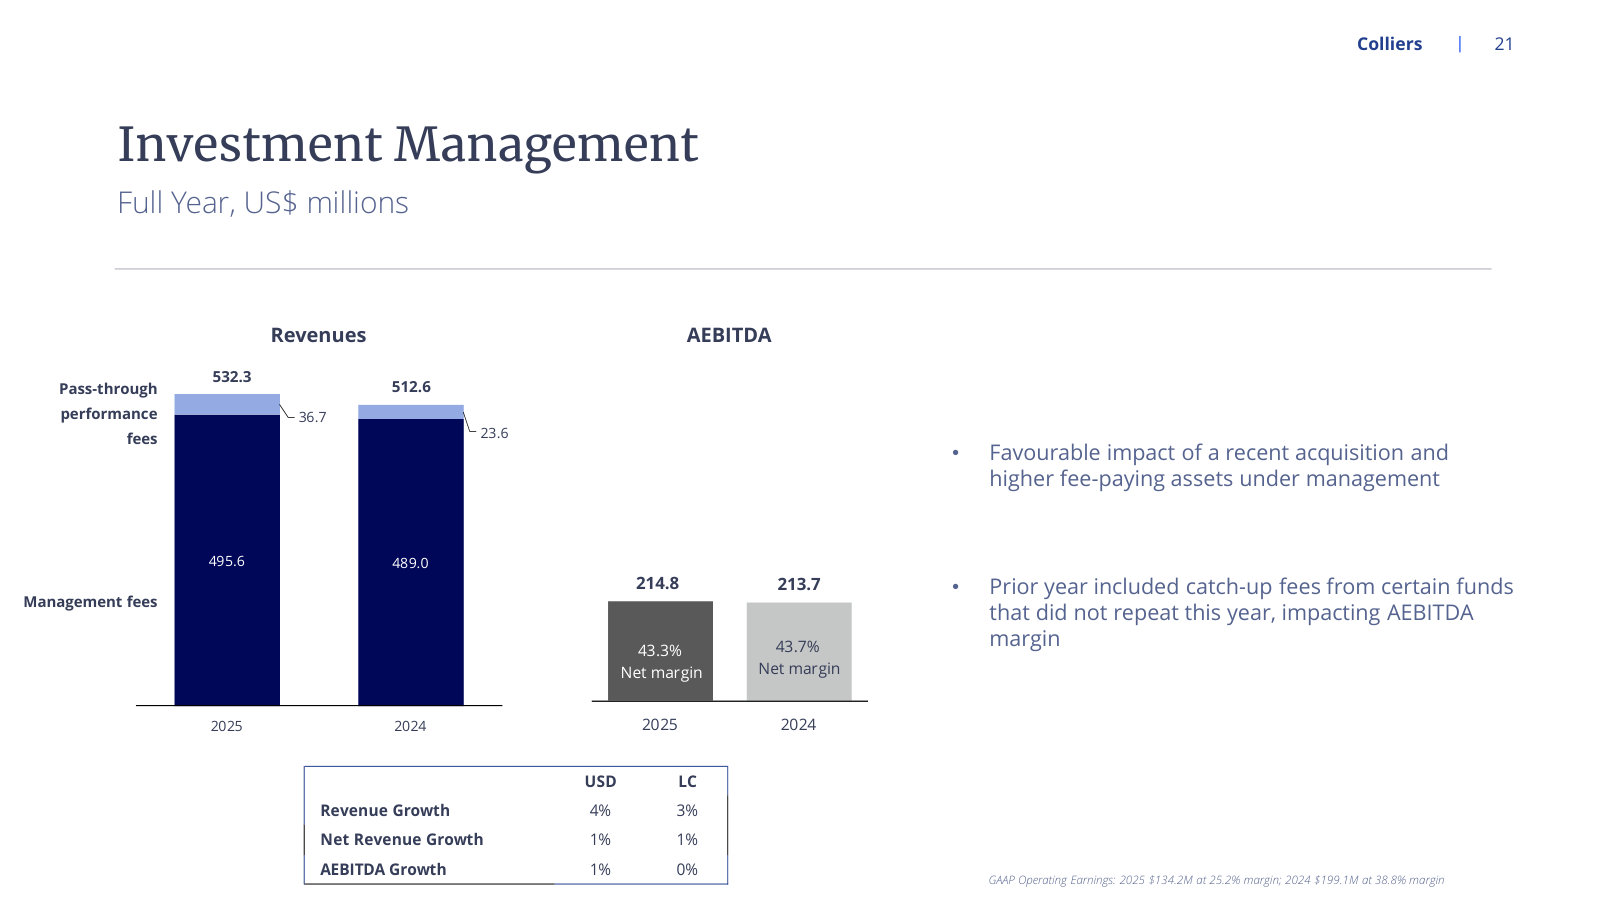
p. 9 — The ~$700M Ayesa acquisition in full — price, 12.5x EBITDA multiple, financing, geography and end markets. · Open the full presentation →p. 19 — FY2025 real estate by service line at a 12.0% net margin — the annual view of the core business. · Open the full presentation →p. 20 — FY2025 Engineering: 40% revenue growth and margin up to 12.6%, before Ayesa consolidates. · Open the full presentation →p. 21 — FY2025 Investment Management: flat net revenue at a 43.3% margin, with prior-year catch-up fees explained. · Open the full presentation →
First Quarter 2026 Results — Q1 2026 · 15 pages · The first print against 2026 guidance, and the last quarter before Ayesa closed. · Open →
Fourth Quarter 2024 Financial Results — Q4 2024 · 20 pages · FY2024 full-year segment results and the original 2025 outlook — the base year for today's growth rates. · Open →
Fourth Quarter 2023 Financial Results — Q4 2023 · 25 pages · The cycle trough: FY2023, when Capital Markets stalled and Engineering had not yet been scaled up. · Open →